Report card for Heirarchical Correlation Mapping on Human SEA-AD benchmark
Overview
The accuracy of cell type mapping using the Hierarchical approximate nearest neighbor (HANN) algorithm was evaluated against the SEA-AD human MTG benchmark.
In summary, Heirarchical Correlation Mapping was able to achieve strong accuracy at all resolution of the human MTG taxonomy containing donor-specific batch effects.
- Summary:
- Inputs
Xare log(CPM) normalized expression values of marker genes. - Hierarchy was encoded by Class, Subclass, Supertype.
Confidencevalues were derived via bootstraping.
- Inputs
- Runtime: 3.03 Hours
- Version: X.Y.Z
- Repository: TBD
- Publication: –
| Annotaion | F1-score |
|---|---|
| Class | 0.999 |
| Subclass | 0.985 |
| Supertype | 0.859 |
Tasks
- Primary tasks:
- Classification of scRNA-seq samples into Supertypes.
- Determining generalization of
Heirarchical Correlation Mappingclassification to samples from new donors under varying degrees of Alzheimers pathology.
- Users: AIBS scientists and community mapping tool users.
- Out of scope: Classification on other modalities (e.g. SMART-seq, Patch-seq, MERFISH), or regions (e.g. V1), or species (e.g. primate)
Metrics
- Accuracy
- Precision, Recall, F1-score on validation set
Reference and query evaluation data
- Reference
- Human MTG single nucleus 10xV3 dataset from aged healthy individuals.
- Supertype and donor metadata provided for each reference sample.
- Query
- Human MTG single nucleus 10xV3 data from donors of varying Alzheimers pathology.
- No AD
- Low
- Intermediate
- High
- Human MTG single nucleus 10xV3 data from donors of varying Alzheimers pathology.
Quantitative analysis
Here we evaluate Heirarchical Correlation Mapping at predicting high quality samples for each of the query datasets from the human SEA-AD benchmark.
Class metrics:
1. Label-wise F1-score 2. Confidence values for correctly and incorrectly assigned labels
 3. Label-wise recall
 4. Label-wise precision
 5. Confusion matrix (row-normalized)
Subclass metrics:
1. Label-wise F1-score 2. Confidence values for correctly and incorrectly assigned labels
 3. Label-wise recall
 4. Label-wise precision
 5. Confusion matrix (row-normalized)
Supertype metrics:
1. Label-wise F1-score 2. Confidence values for correctly and incorrectly assigned labels
 3. Label-wise recall
 4. Label-wise precision
 5. Confusion matrix (row-normalized)
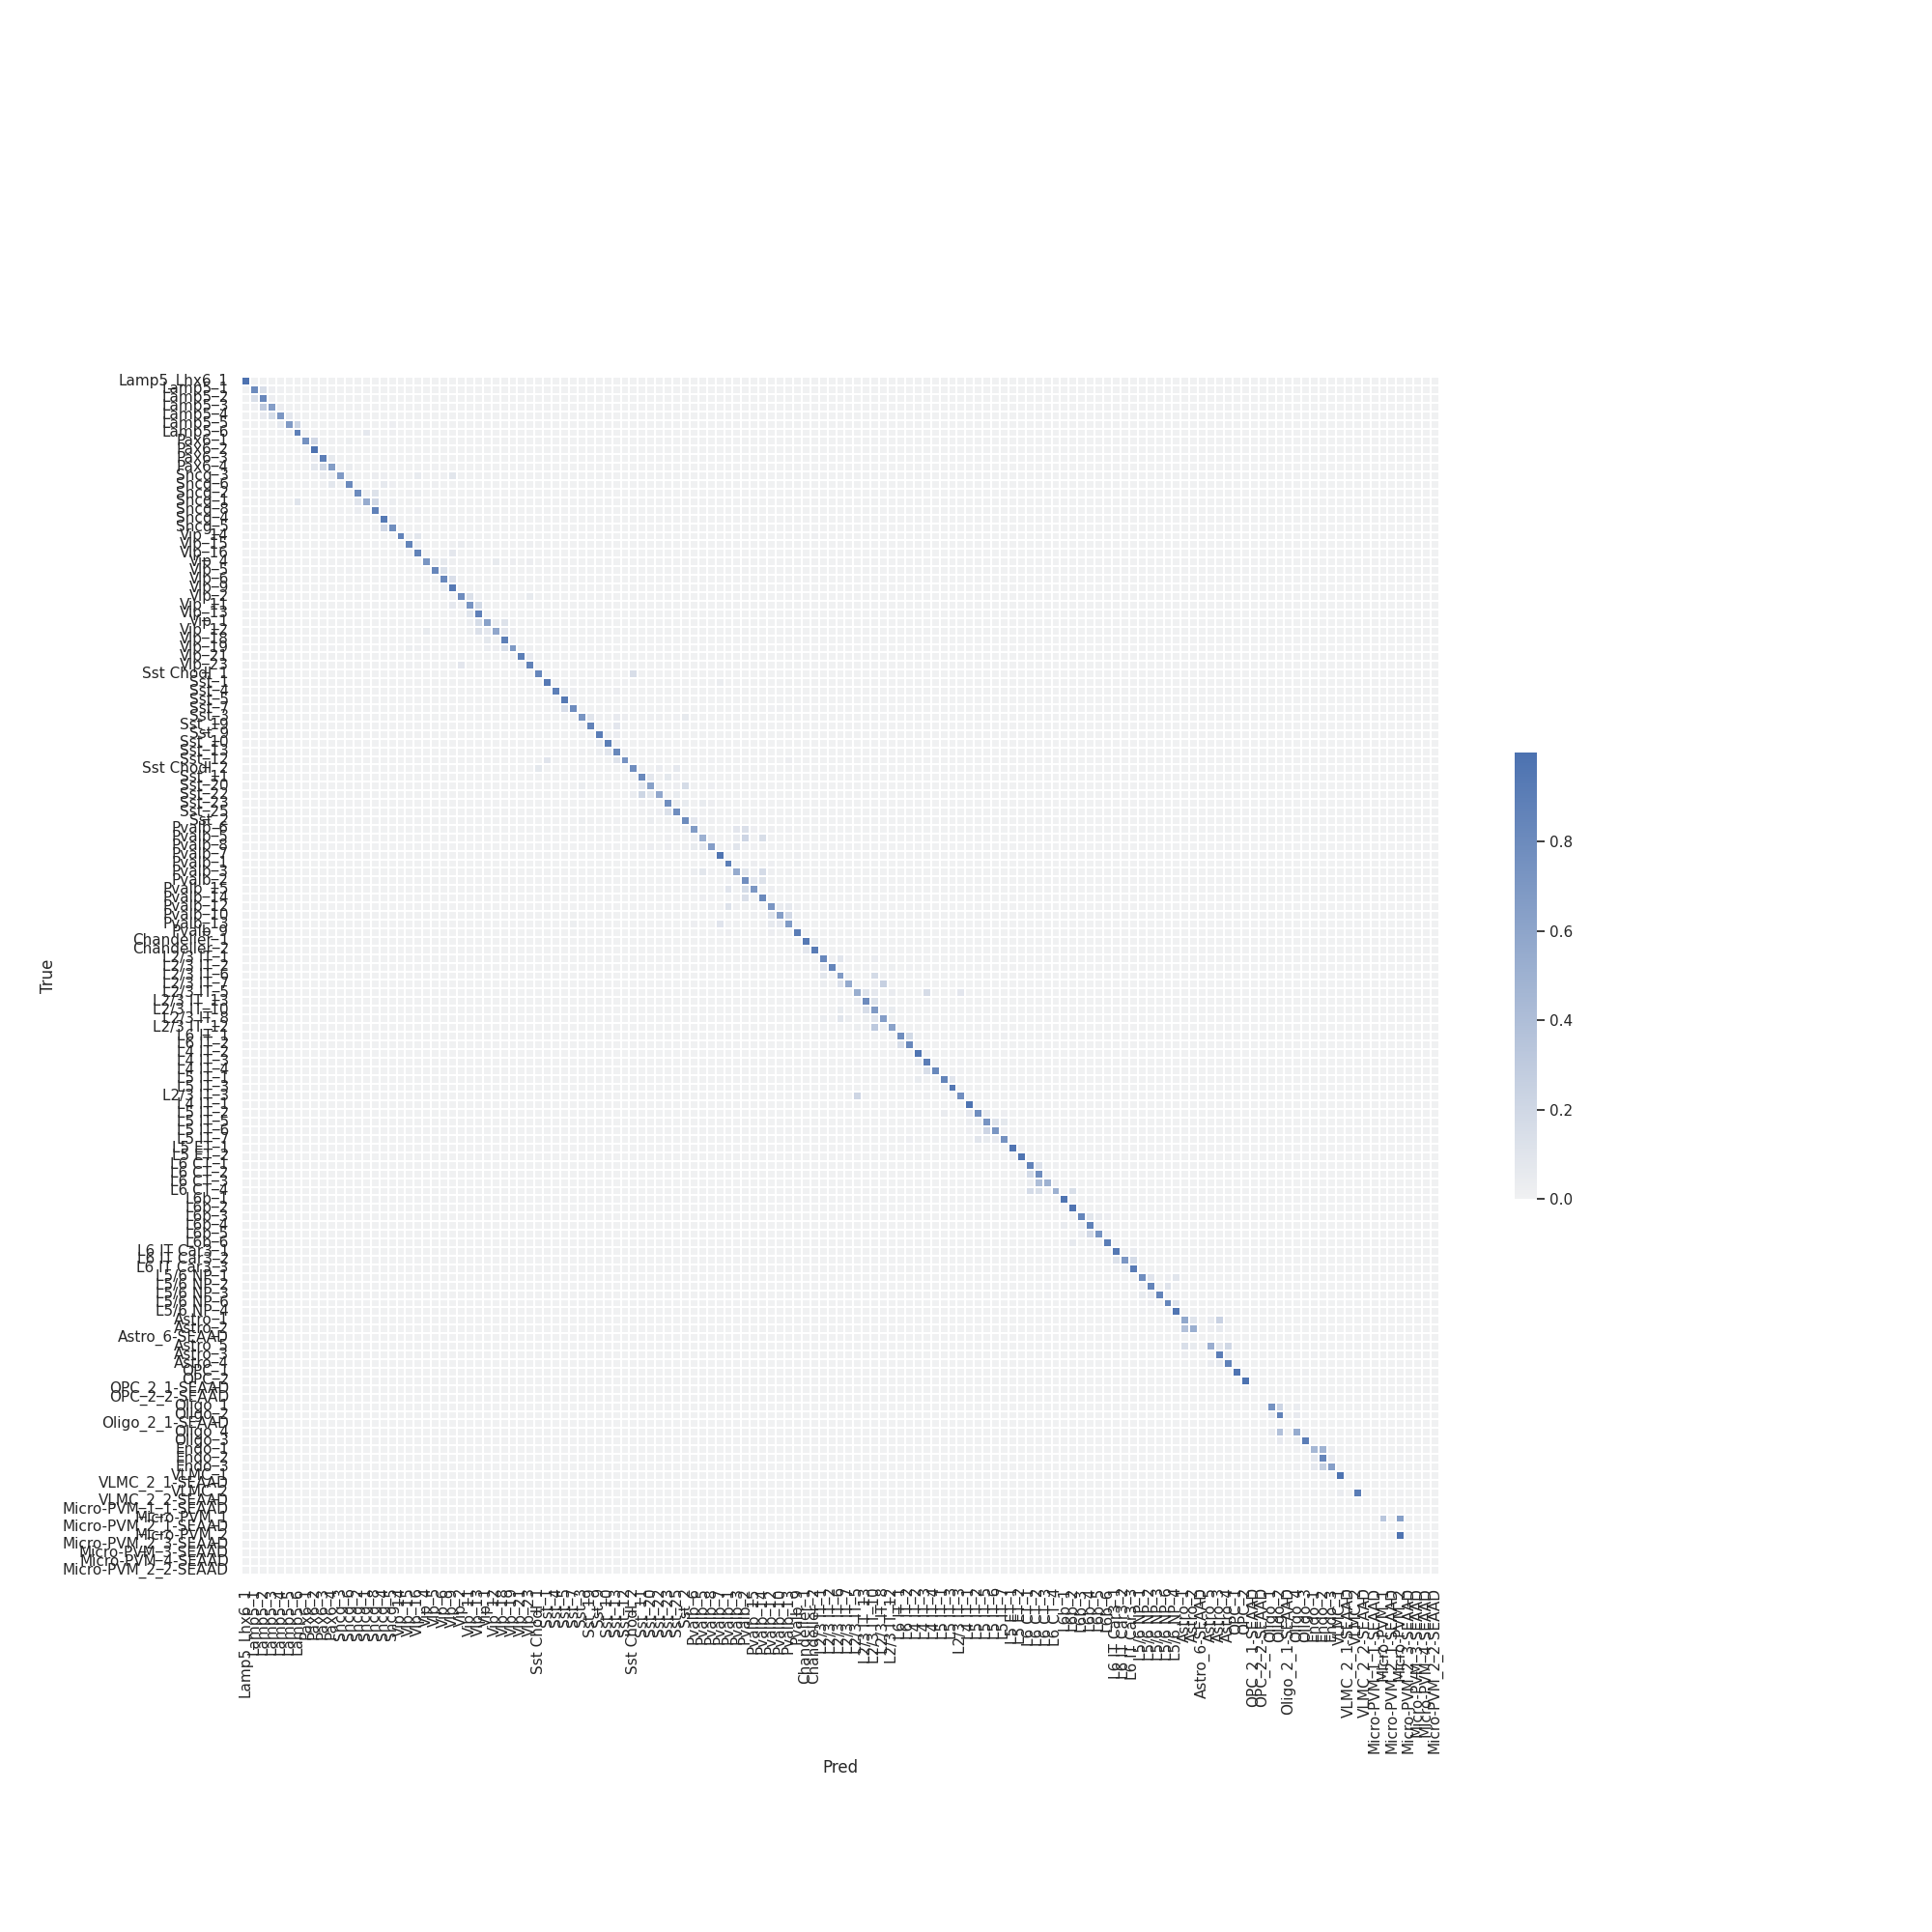
Donor effect analysis
Here we evaluate Heirarchical Correlation Mapping at correctly predicting the Subclass label for increasingly sever Alzheimers pathology.
| Annotation | Query | F1-score |
|---|---|---|
| Supertype | Reference_MTG_RNASeq_benchmark | 0.988 |
| Supertype | Not_AD_MTG_RNASeq_benchmark | 0.988 |
| Supertype | Low_MTG_RNASeq_benchmark | 0.987 |
| Supertype | Intermediate_MTG_RNASeq_benchmark | 0.985 |
| Supertype | High_MTG_RNASeq_benchmark | 0.983 |
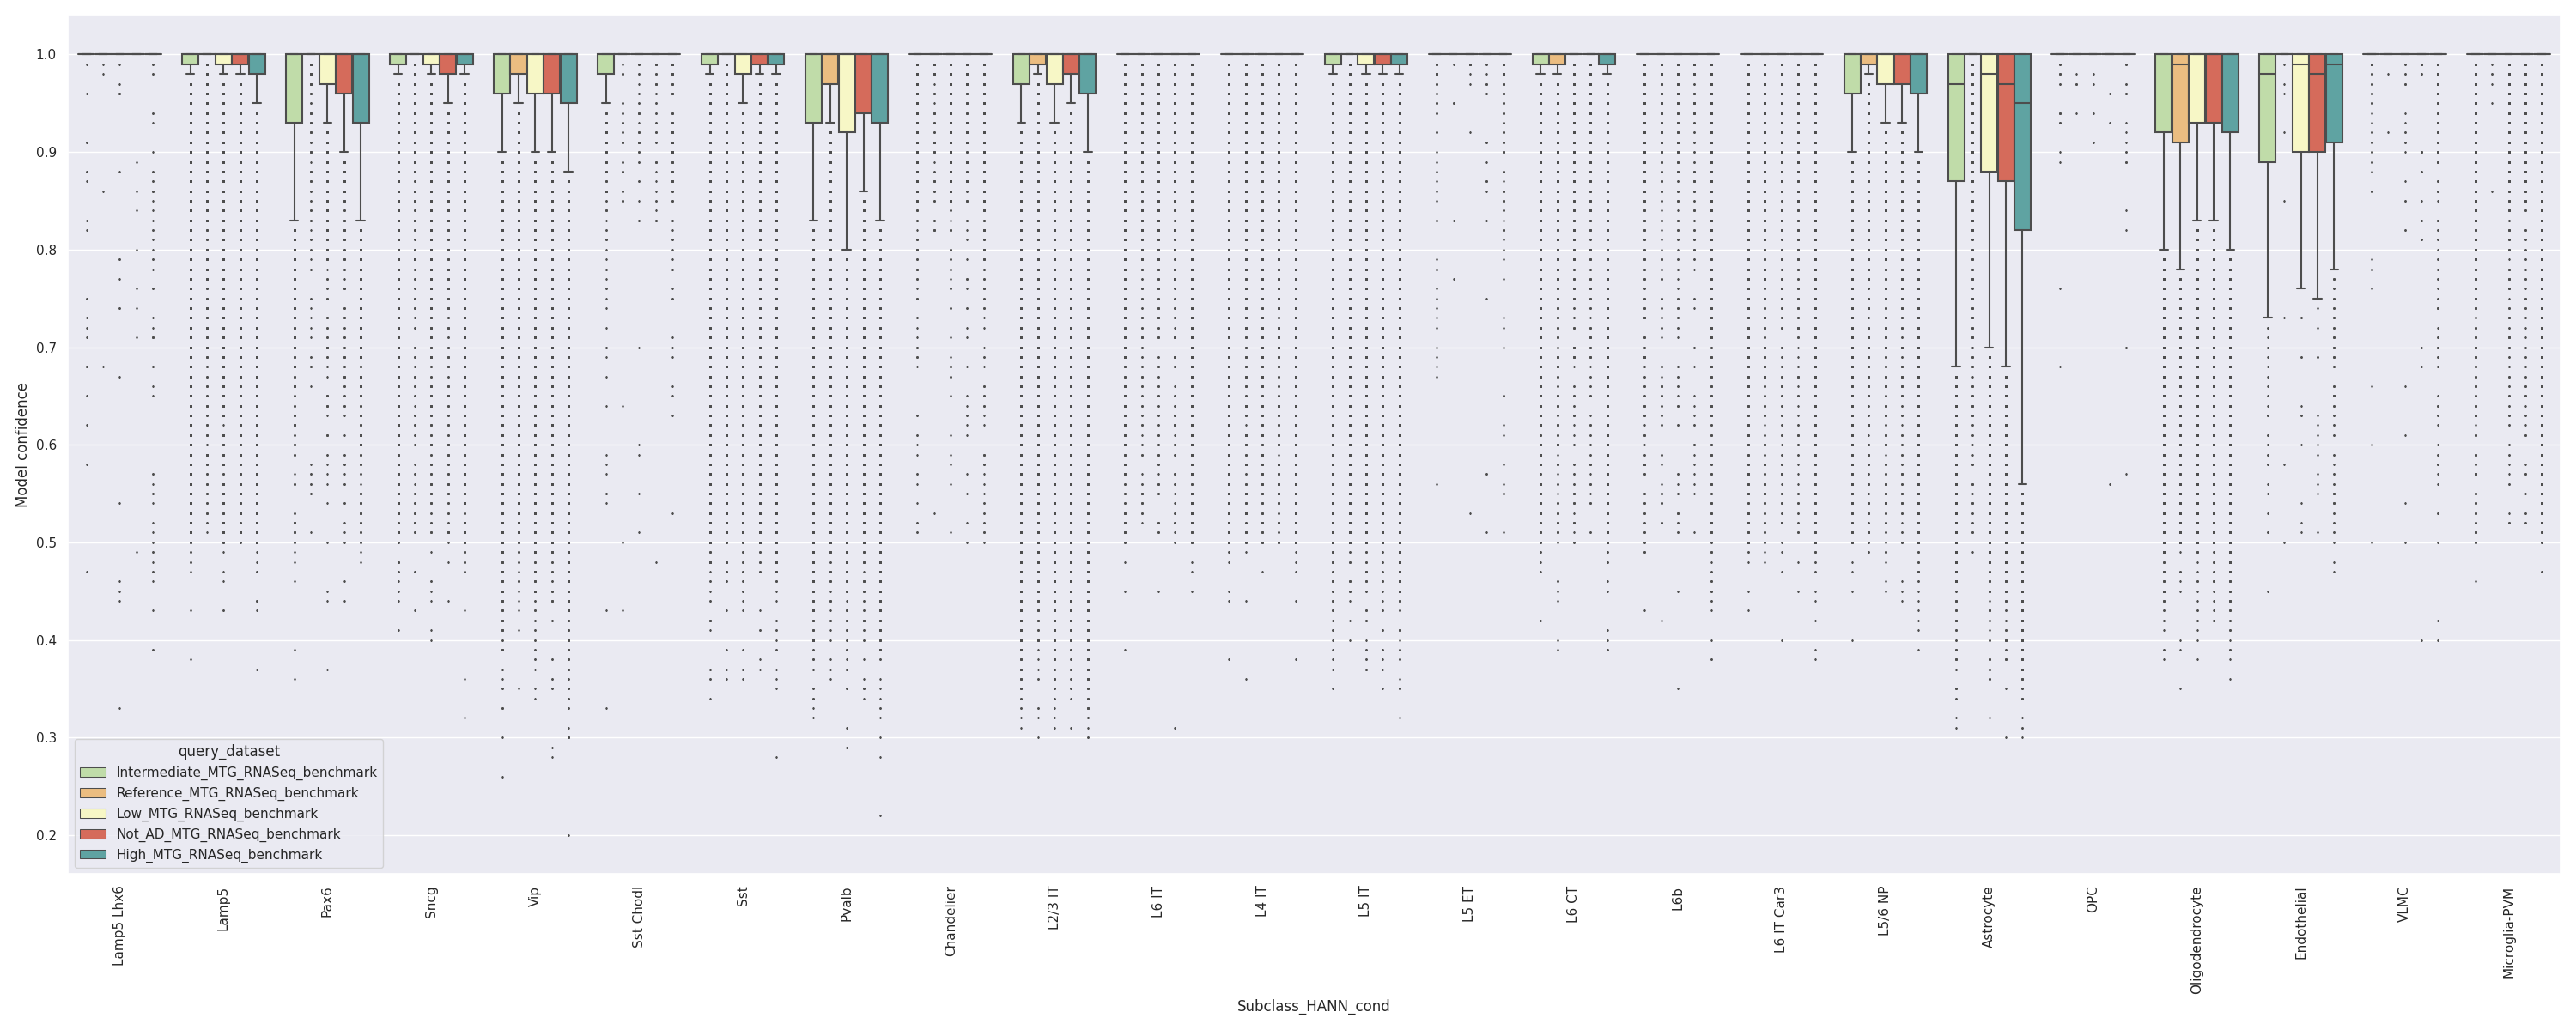
Low quality sample analysis
Here we evaluate how Heirarchical Correlation Mapping predicts labels for low-quality samples in the query data with predefined QC flags.

And how confident the model is when predicting labels for high and low quality data for each subclass.

Recommendations and caveats
- At the Class and Subclass level, for high quality RNA-seq data -
Heirarchical Correlation Mappingmakes few errors. Heirarchical Correlation Mappingrobustly classify samples under varying conditions imparting donor and disease specific changes in gene expression.- When
Heirarchical Correlation Mappingmakes a mistake at the Supertype level, the predicted label is typically within the same Subclass.