Report card for Heirarchical Correlation Mapping on Mouse whole brain (cortex) benchmark
Overview
The accuracy of cell type mapping using the Hierarchical approximate nearest neighbor (HANN) algorithm was evaluated against the mouse whole brain (WB) cortical taxonomy.
In summary, Heirarchical Correlation Mapping was able to achieve strong accuracy at class, neighborhood and subclass resolution of the mouse WB cortical taxonomy containing sequencing technology batch effects.
- Summary:
- Inputs
Xare log(CPM) normalized expression values of marker genes. - Hierarchy was encoded by Class, Neighborhood, Subclass, Cluster.
Confidencevalues were derived via bootstraping.
- Inputs
- Runtime: 0.77 Hours
- Version: X.Y.Z
- Repository: TBD
- Publication: –
Tasks
- Primary tasks:
- Classification of scRNA-seq samples into whole brain clusters.
- Determining generalization of
Heirarchical Correlation Mappingclassification to samples from multiple sequencing technologies.
- Users: AIBS scientists and community mapping tool users.
- Out of scope: Classification on other modalities (e.g. SMART-seq, Patch-seq, MERFISH), or regions (e.g. V1), or species (e.g. primate)
Metrics
- Accuracy
- Precision, Recall, F1-score on validation set
Reference and query evaluation data
- Reference
- Mouse whole brain taxonomy single nucleus 10xV3 dataset from aged healthy individuals.
- Cluster and sequencing technology metadata provided for each reference sample.
- Query
- Mouse whole brain taxonomy data from multiple sequencing technologies.
- SmartSeq_cells_AIBS
- SmartSeq_nuclei_AIBS
- 10X_cells_v2_AIBS
- 10X_nuclei_v2_AIBS
- 10X_cells_v3_AIBS
- 10X_nuclei_v3_AIBS
- 10X_nuclei_v3_Broad
- Mouse whole brain taxonomy data from multiple sequencing technologies.
Quantitative analysis
Here we evaluate Heirarchical Correlation Mapping at predicting high quality samples for each of the query datasets. Each annotation level can be expanded to reveal addition evaluation metrics.
| Annotaion | F1-score |
|---|---|
| Class | 0.999 |
| Neighborhood | 0.955 |
| Subclass | 0.955 |
| Mini atlas label | 0.762 |
| Cluster | 0.711 |
Class level metrics:
1. Label-wise F1-score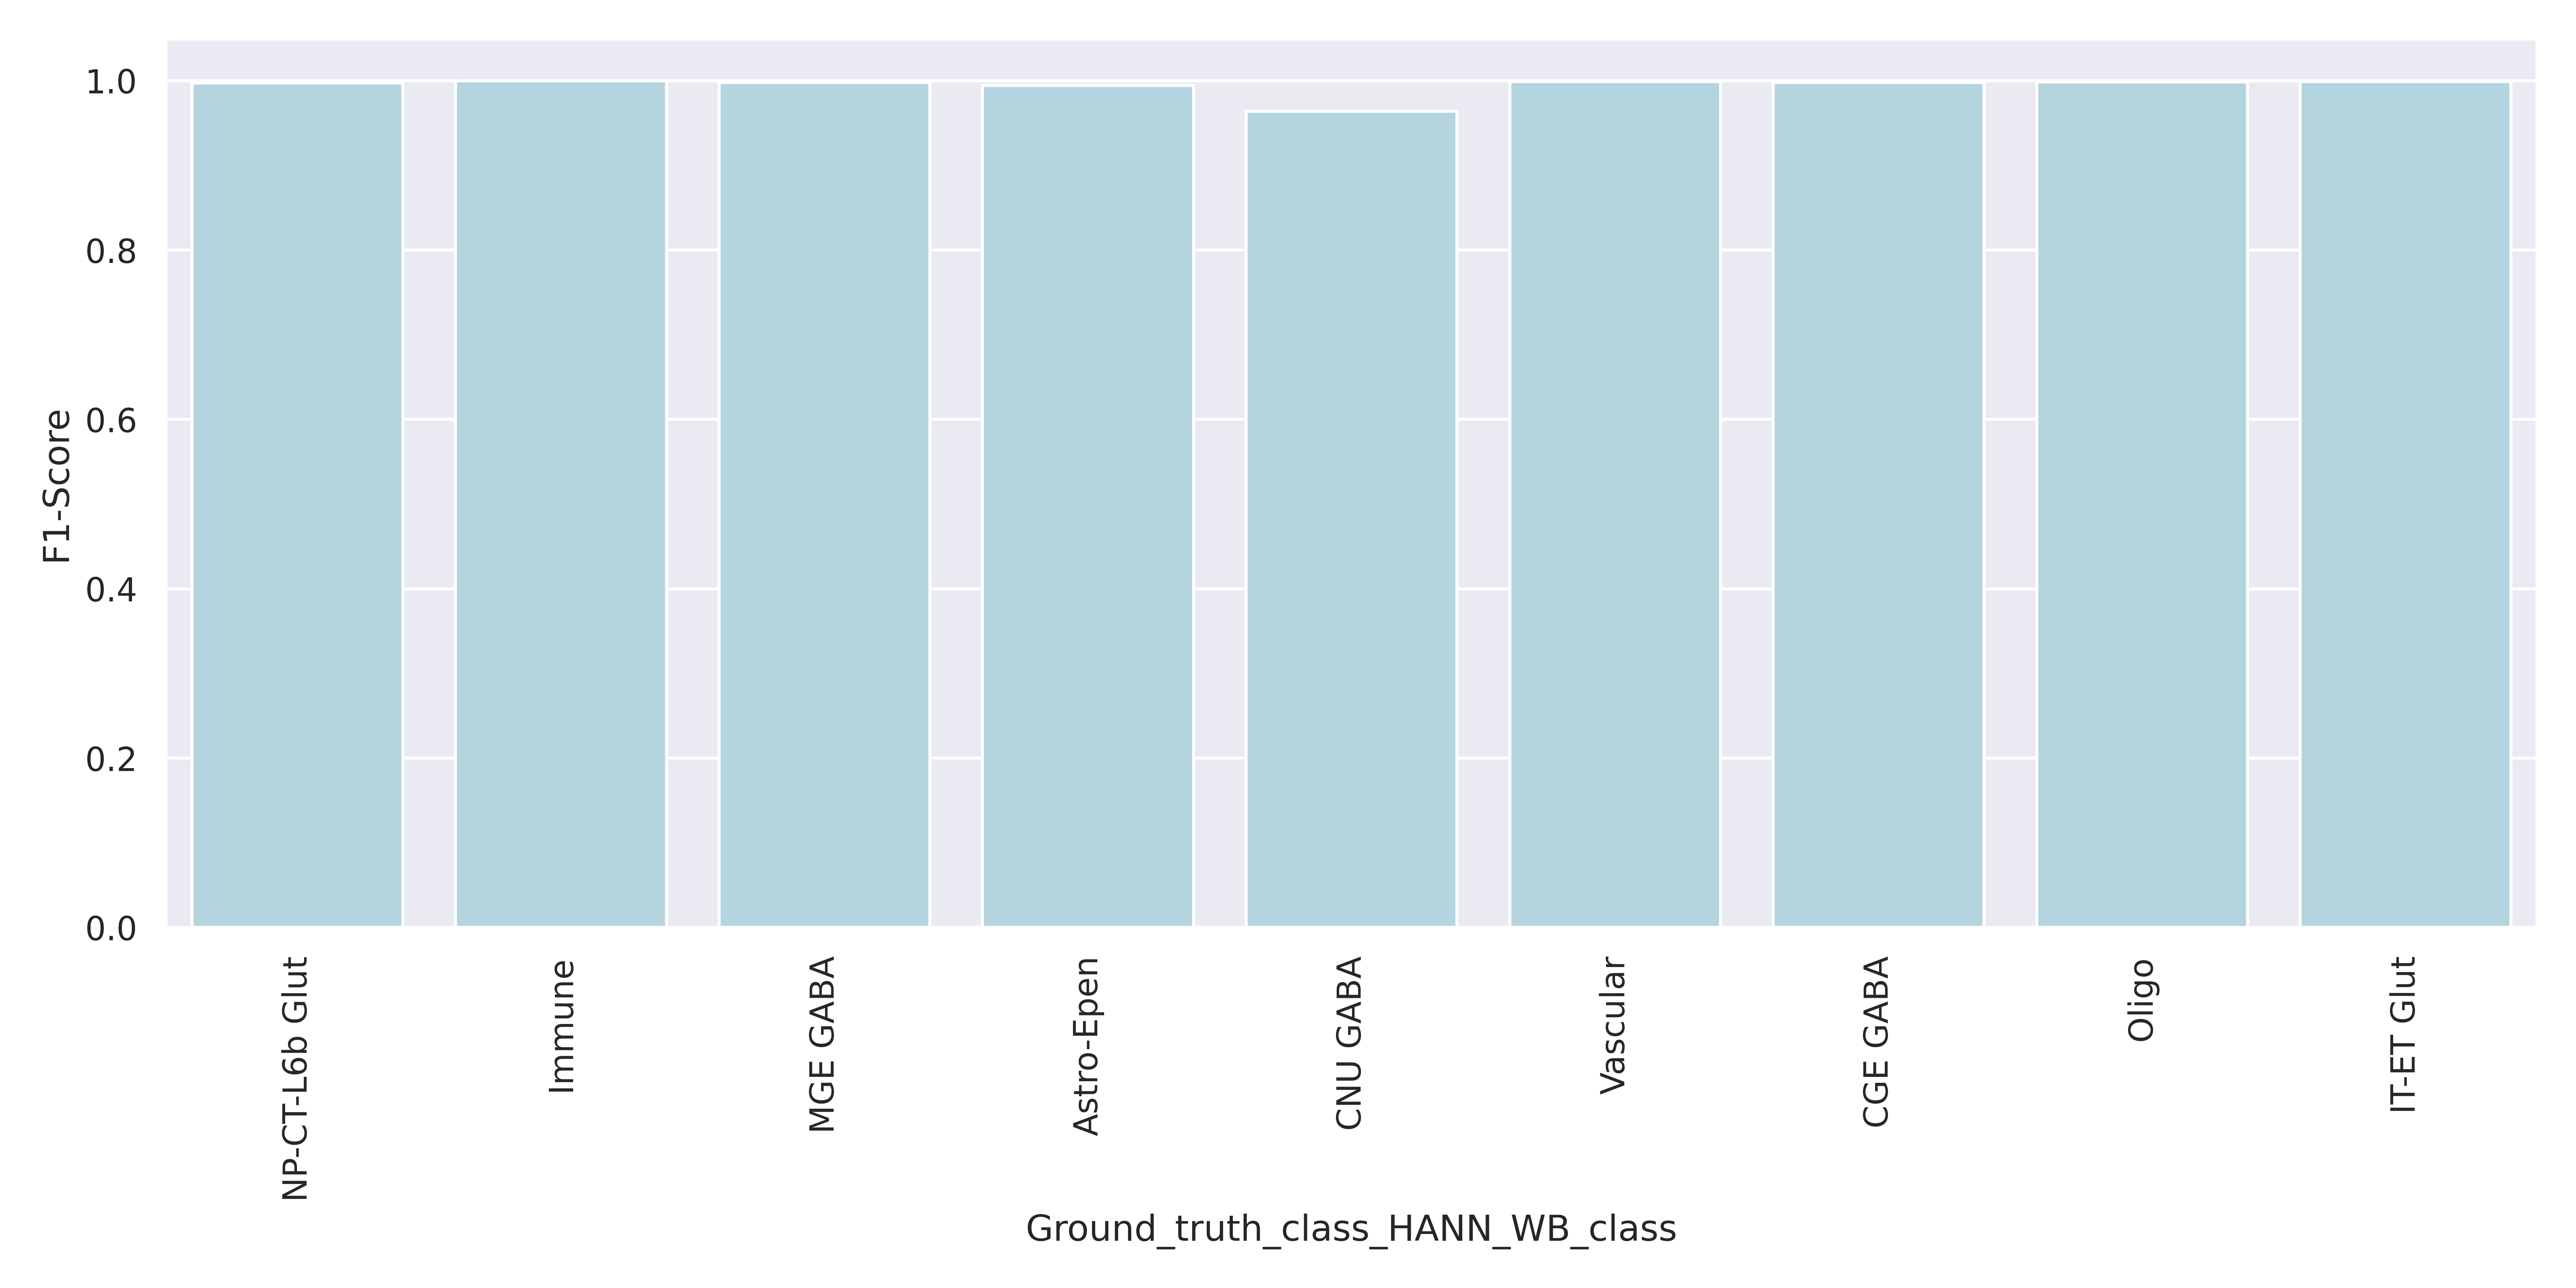 2. Confidence values for correctly and incorrectly assigned labels
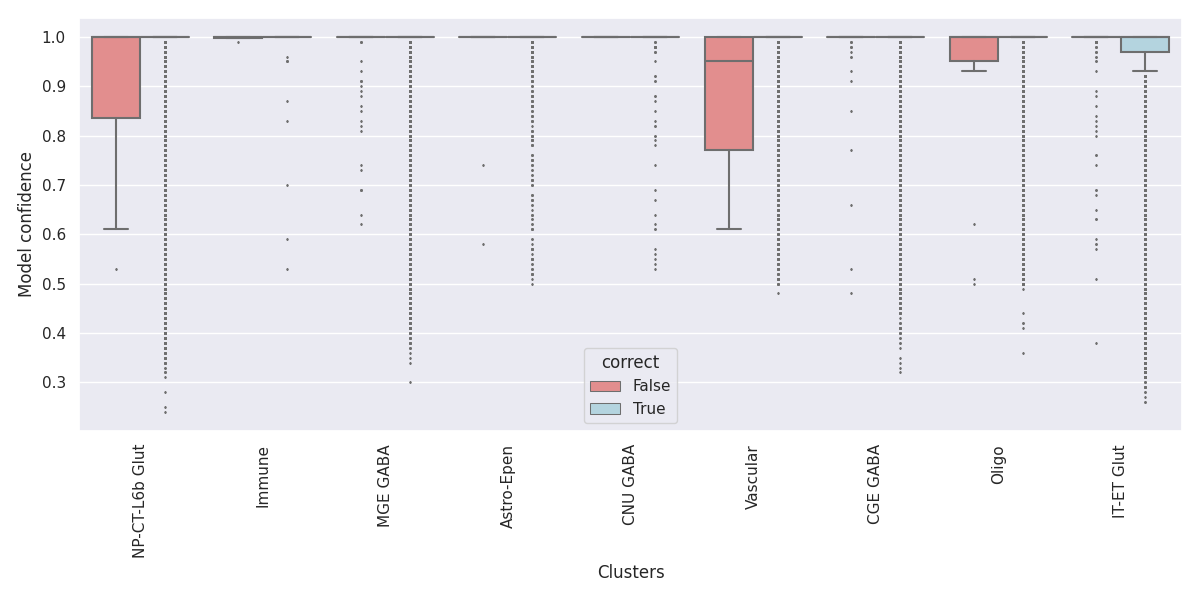 3. Label-wise recall
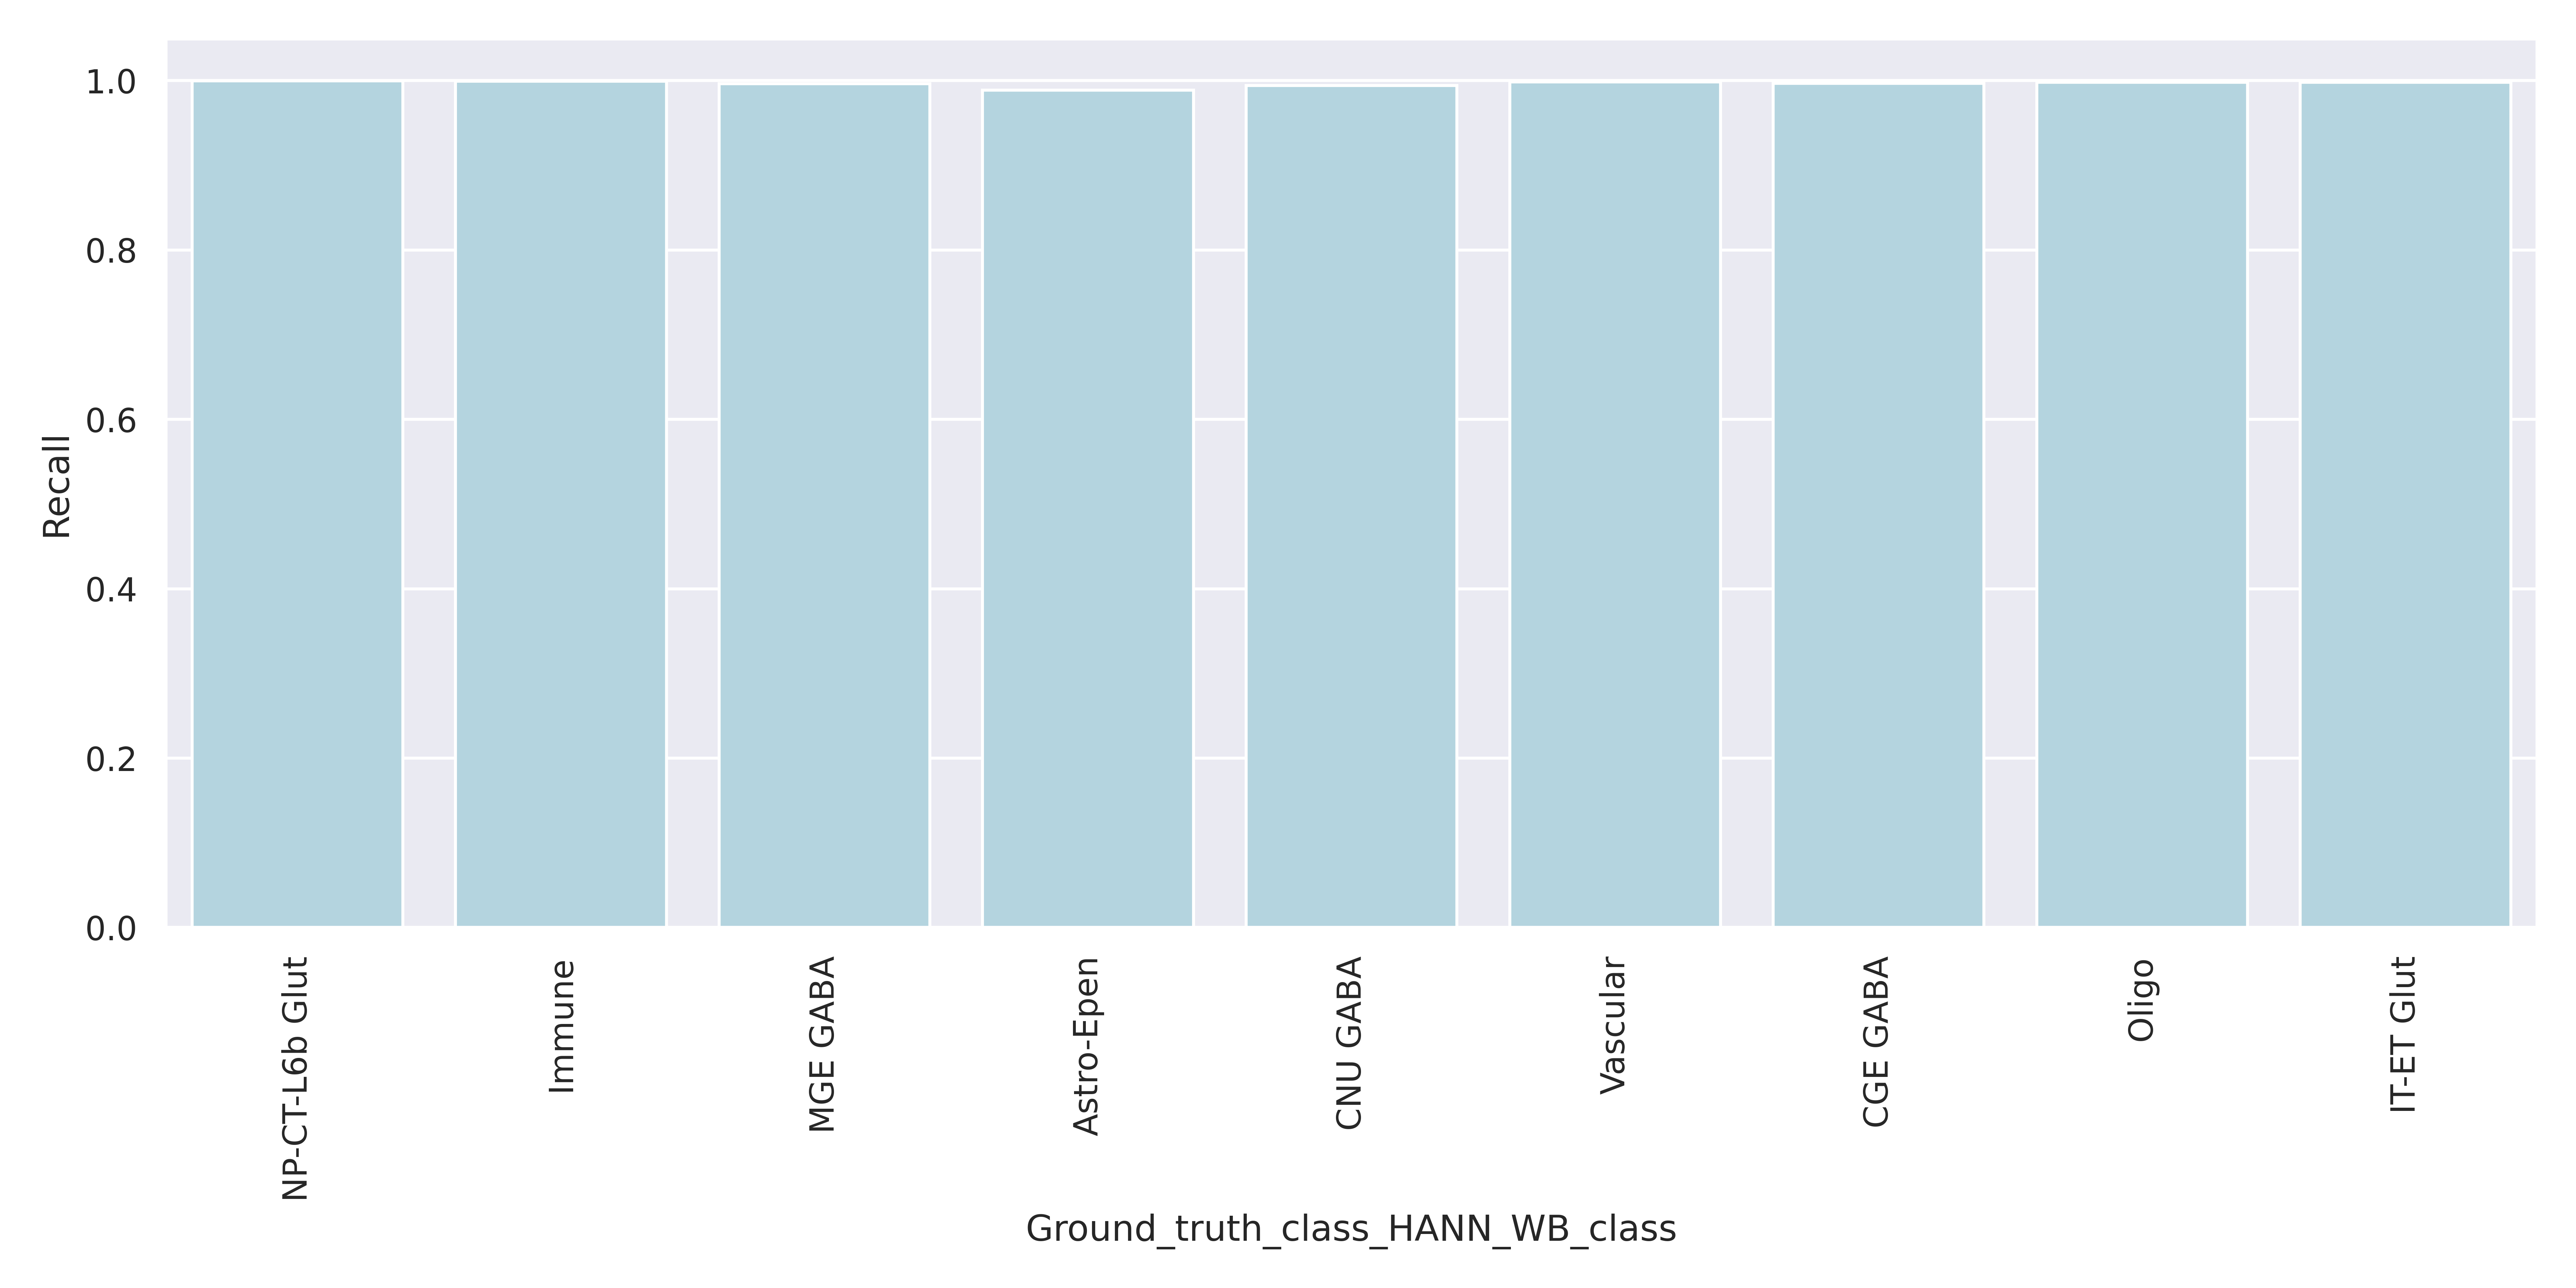 4. Label-wise precision
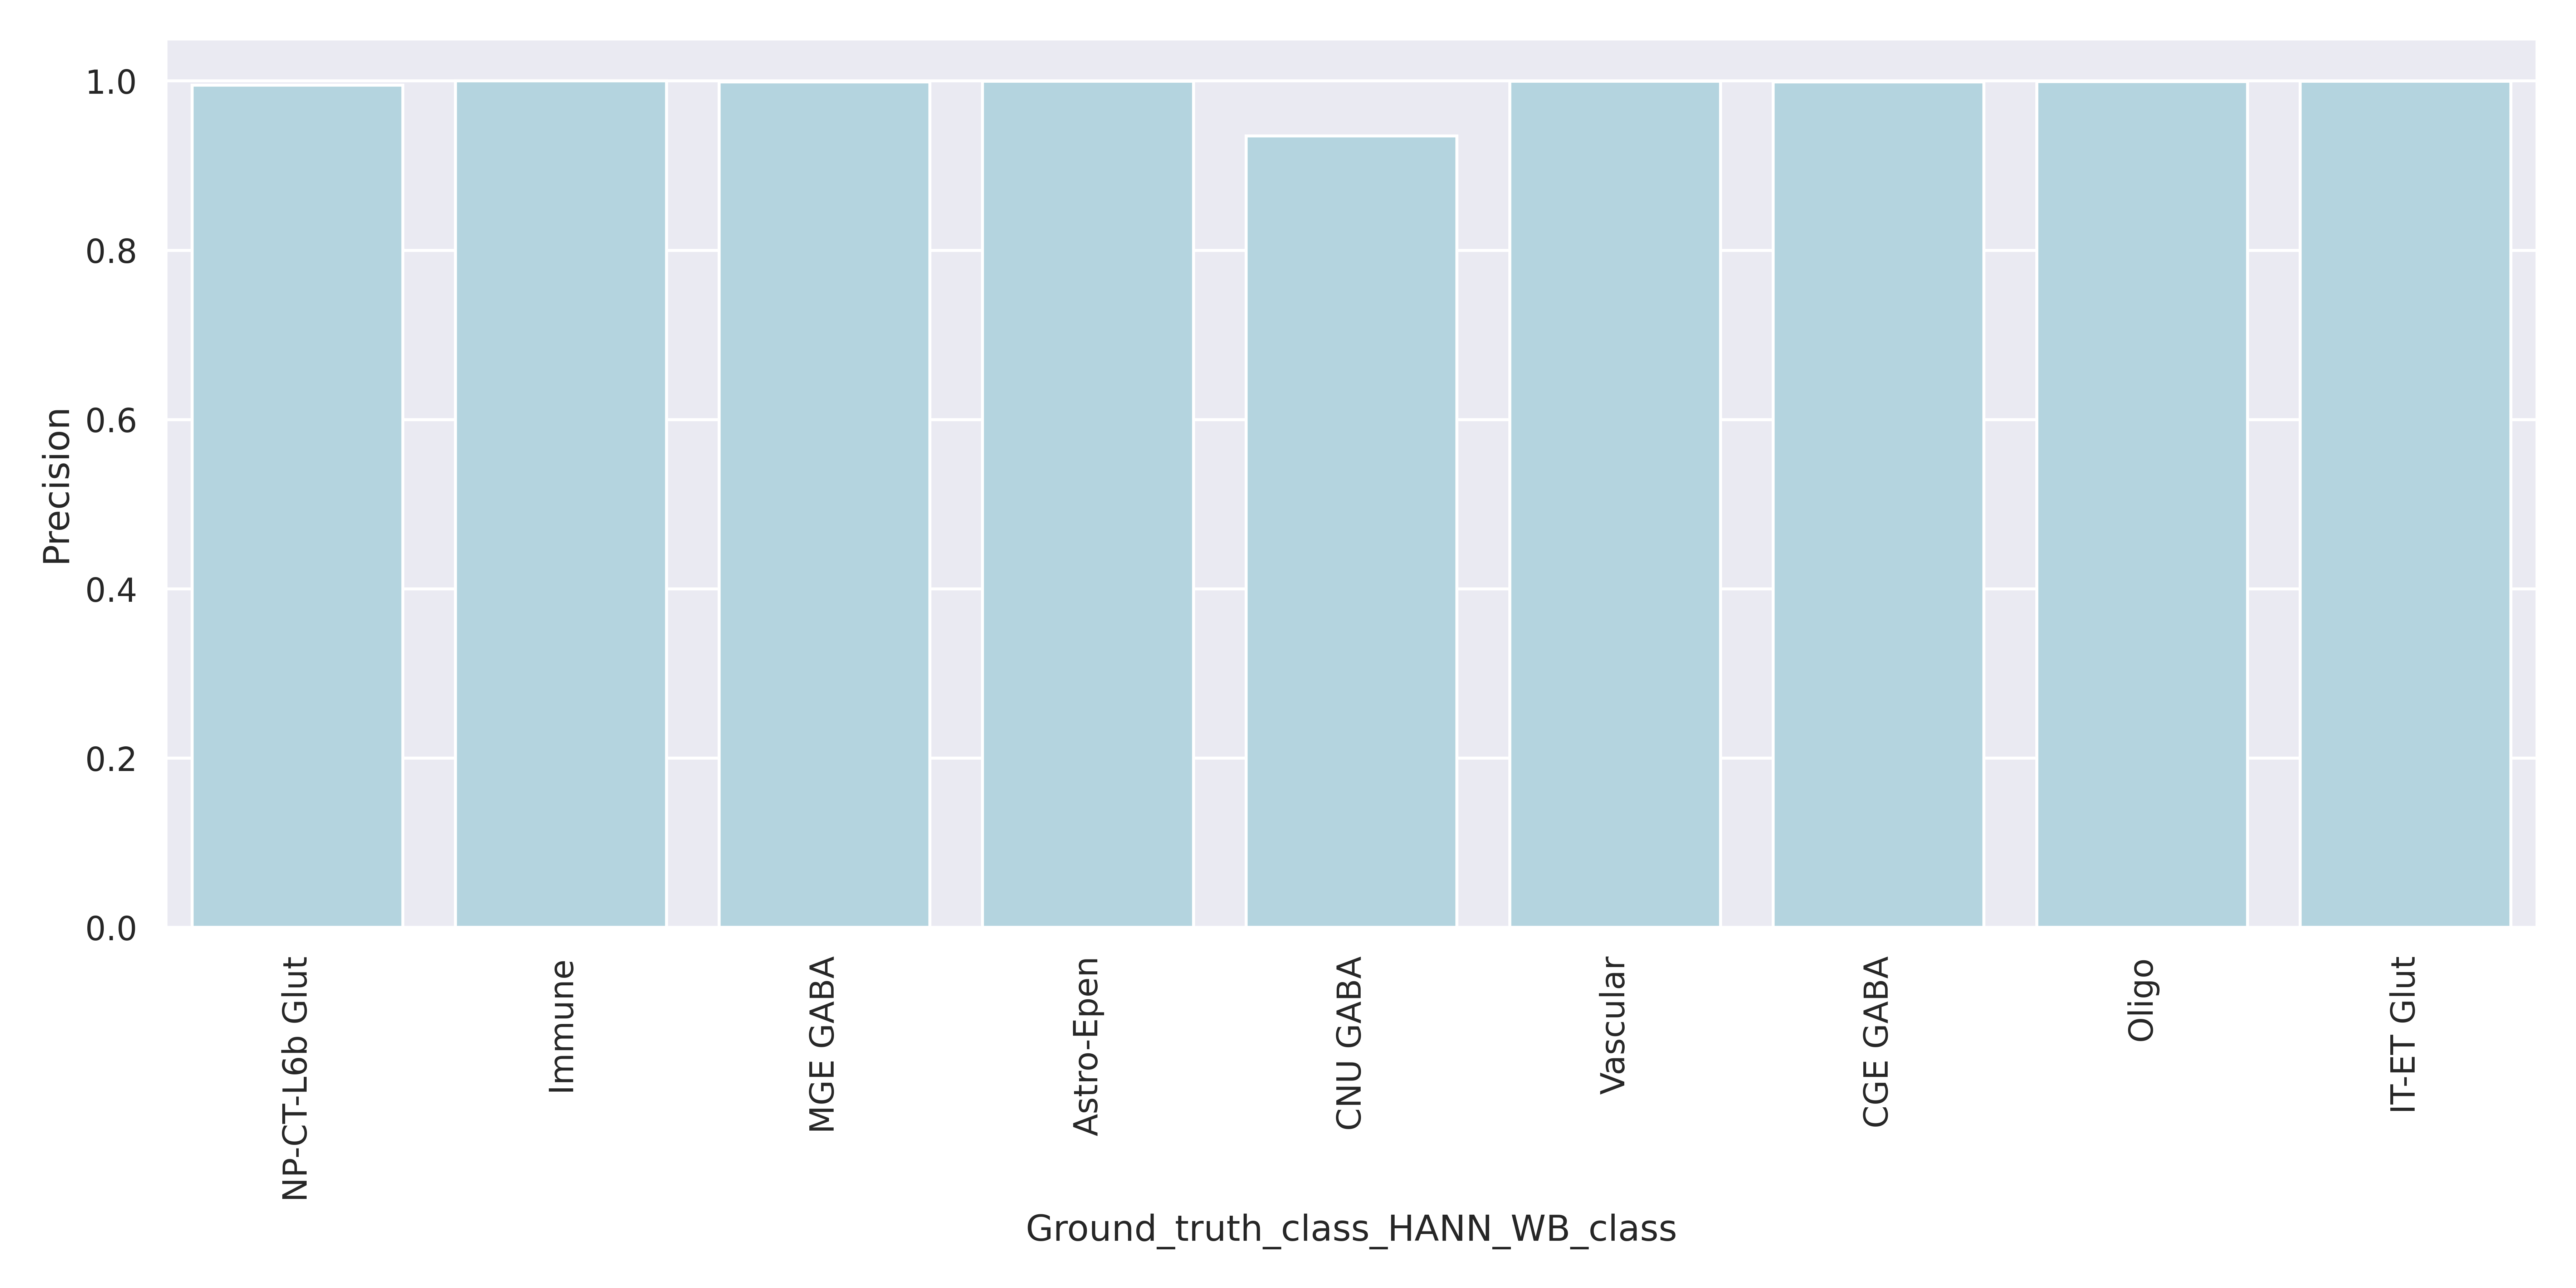 5. Confusion matrix (row-normalized)
Neighborhood level metrics:
1. Label-wise F1-score 2. Confidence values for correctly and incorrectly assigned labels
 3. Label-wise recall
 4. Label-wise precision
 5. Confusion matrix (row-normalized)
Subclass level metrics:
1. Label-wise F1-score 2. Confidence values for correctly and incorrectly assigned labels
 3. Label-wise recall
 4. Label-wise precision
 5. Confusion matrix (row-normalized)
Cluster metrics:
1. Label-wise F1-score 2. Confidence values for correctly and incorrectly assigned labels
 3. Label-wise recall
 4. Label-wise precision
 5. Confusion matrix (row-normalized)
Sequencing technology effect analysis
Here we evaluate Heirarchical Correlation Mapping at correctly predicting the Subclass label for multiple sequencing technologies.
| Query | Annotation | F1-score | Annotation | F1-score | |
|---|---|---|---|---|---|
| 10X_cells_v3_AIBS | Subclass | 0.972 | Cluster | 0.857 | |
| 10X_nuclei_v3_AIBS | Subclass | 0.943 | Cluster | 0.785 | |
| 10X_nuclei_v3_Broad | Subclass | 0.966 | Cluster | 0.854 | |
| 10X_cells_v2_AIBS | Subclass | 0.976 | Cluster | 0.855 | |
| 10X_nuclei_v2_AIBS | Subclass | 0.918 | Cluster | 0.650 | |
| SmartSeq_cells_AIBS | Subclass | 0.971 | Cluster | 0.812 | |
| SmartSeq_nuclei_AIBS | Subclass | 0.961 | Cluster | 0.803 |
Recommendations and caveats
- At the Class, Neighborhood, and Subclass level, for high quality RNA-seq data -
Heirarchical Correlation Mappingmakes few errors. Heirarchical Correlation Mappingmapping robustly classify samples from multiple sequencing techologies which lead to changes in gene expression.