Great Apes Gorilla
Report card for Correlation, Tree, and Seurat Mapping on Gorilla neocortex (Jorstad et al. 2023)
Overview
A taxonomy was initially built using the gorilla neocortex single nucleus dataset. In building the taxonomy, 1000 binary marker genes were selected based on their gene expression from the single-cell transcriptome. Subsequently, the dataset was mapped to itself, termed self-projection, for evaluating the ideal performances of correlation, tree, and seurat mapping algorithms.
Quantitative analysis
The analysis evaluates the predictions of correlation, tree, and Seurat mappings in determining cluster labels in a self-projection evaluation.
| Annotaion | F1-score |
|---|---|
| Cluster Correlation Mapping | 0.871 |
| Cluster Tree Mapping | 0.844 |
| Cluster Seurat Mapping | 0.996 |
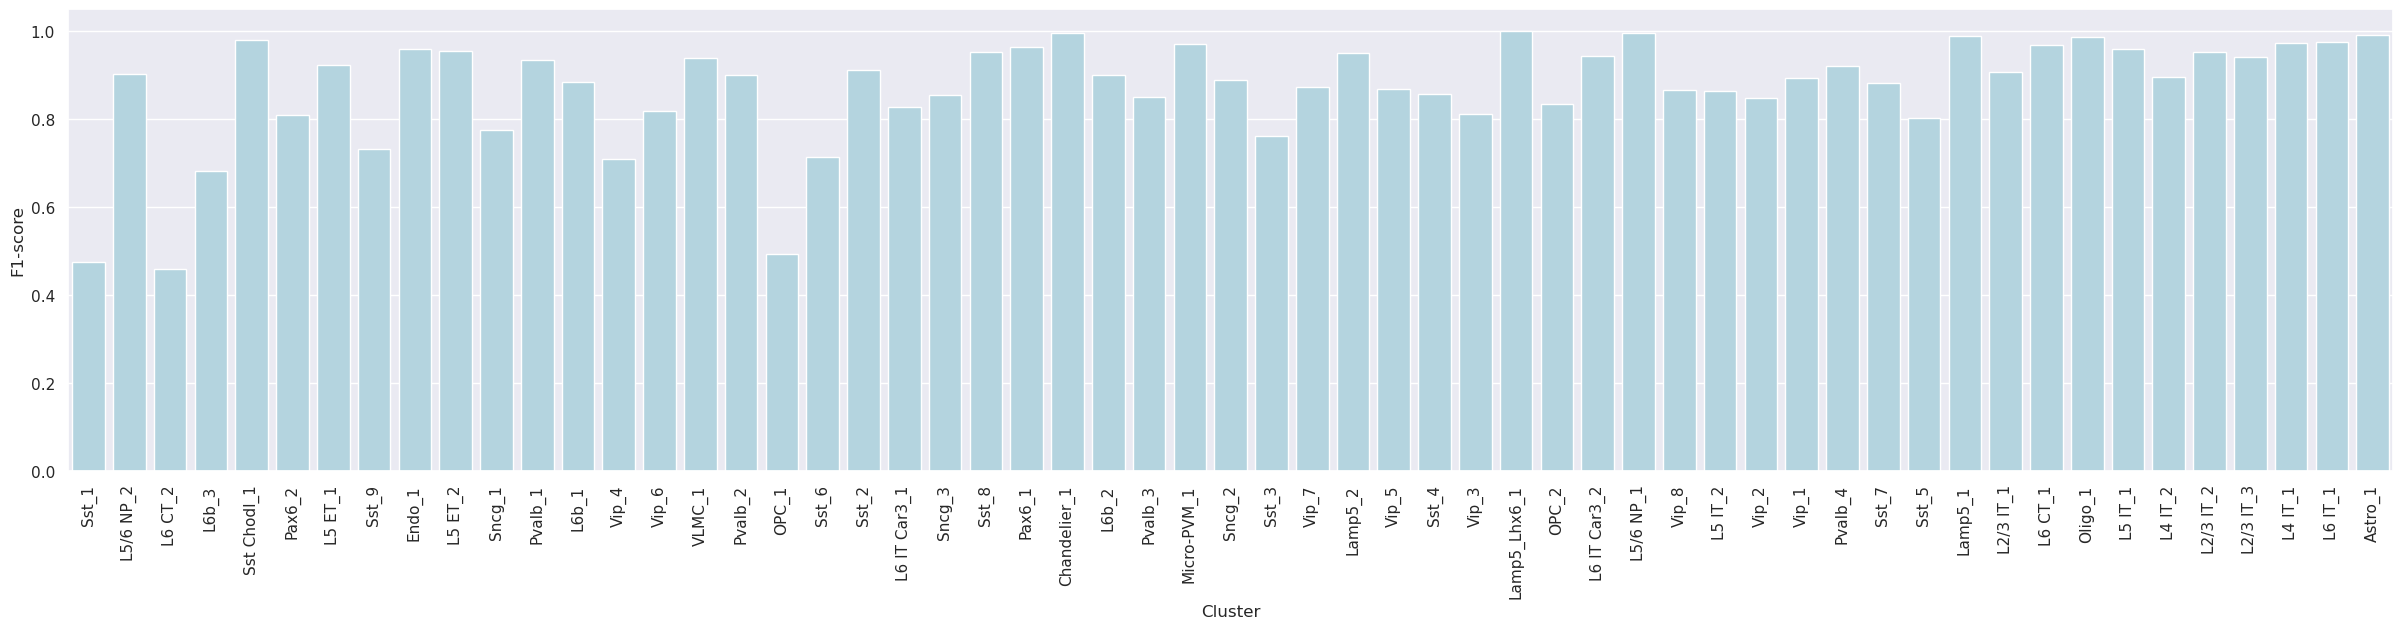
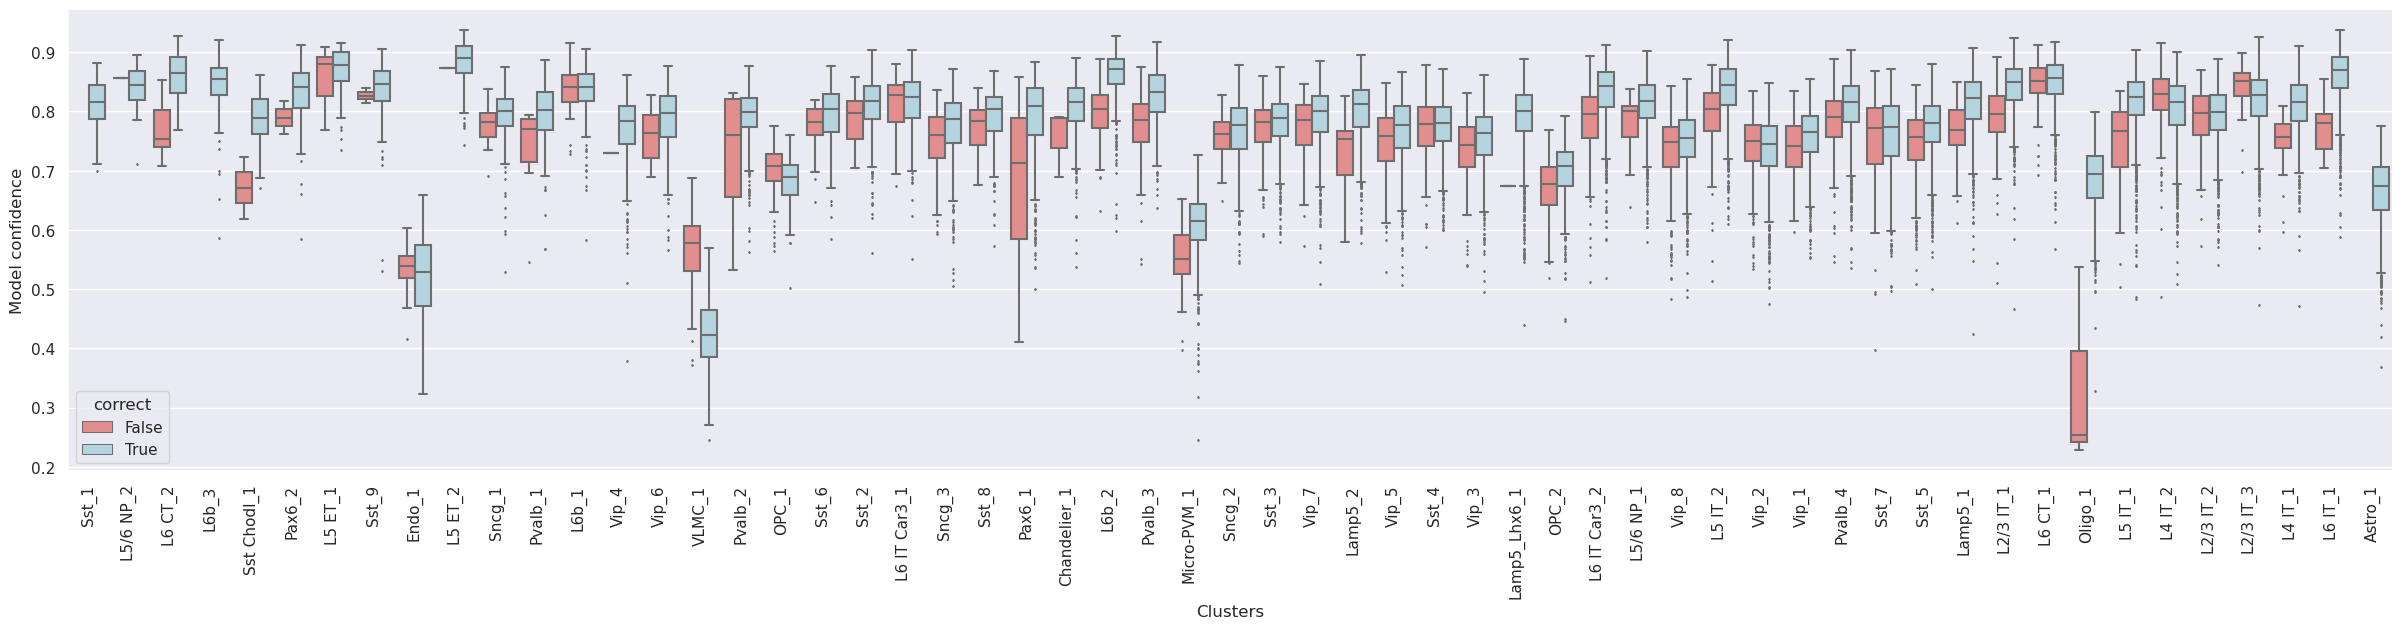
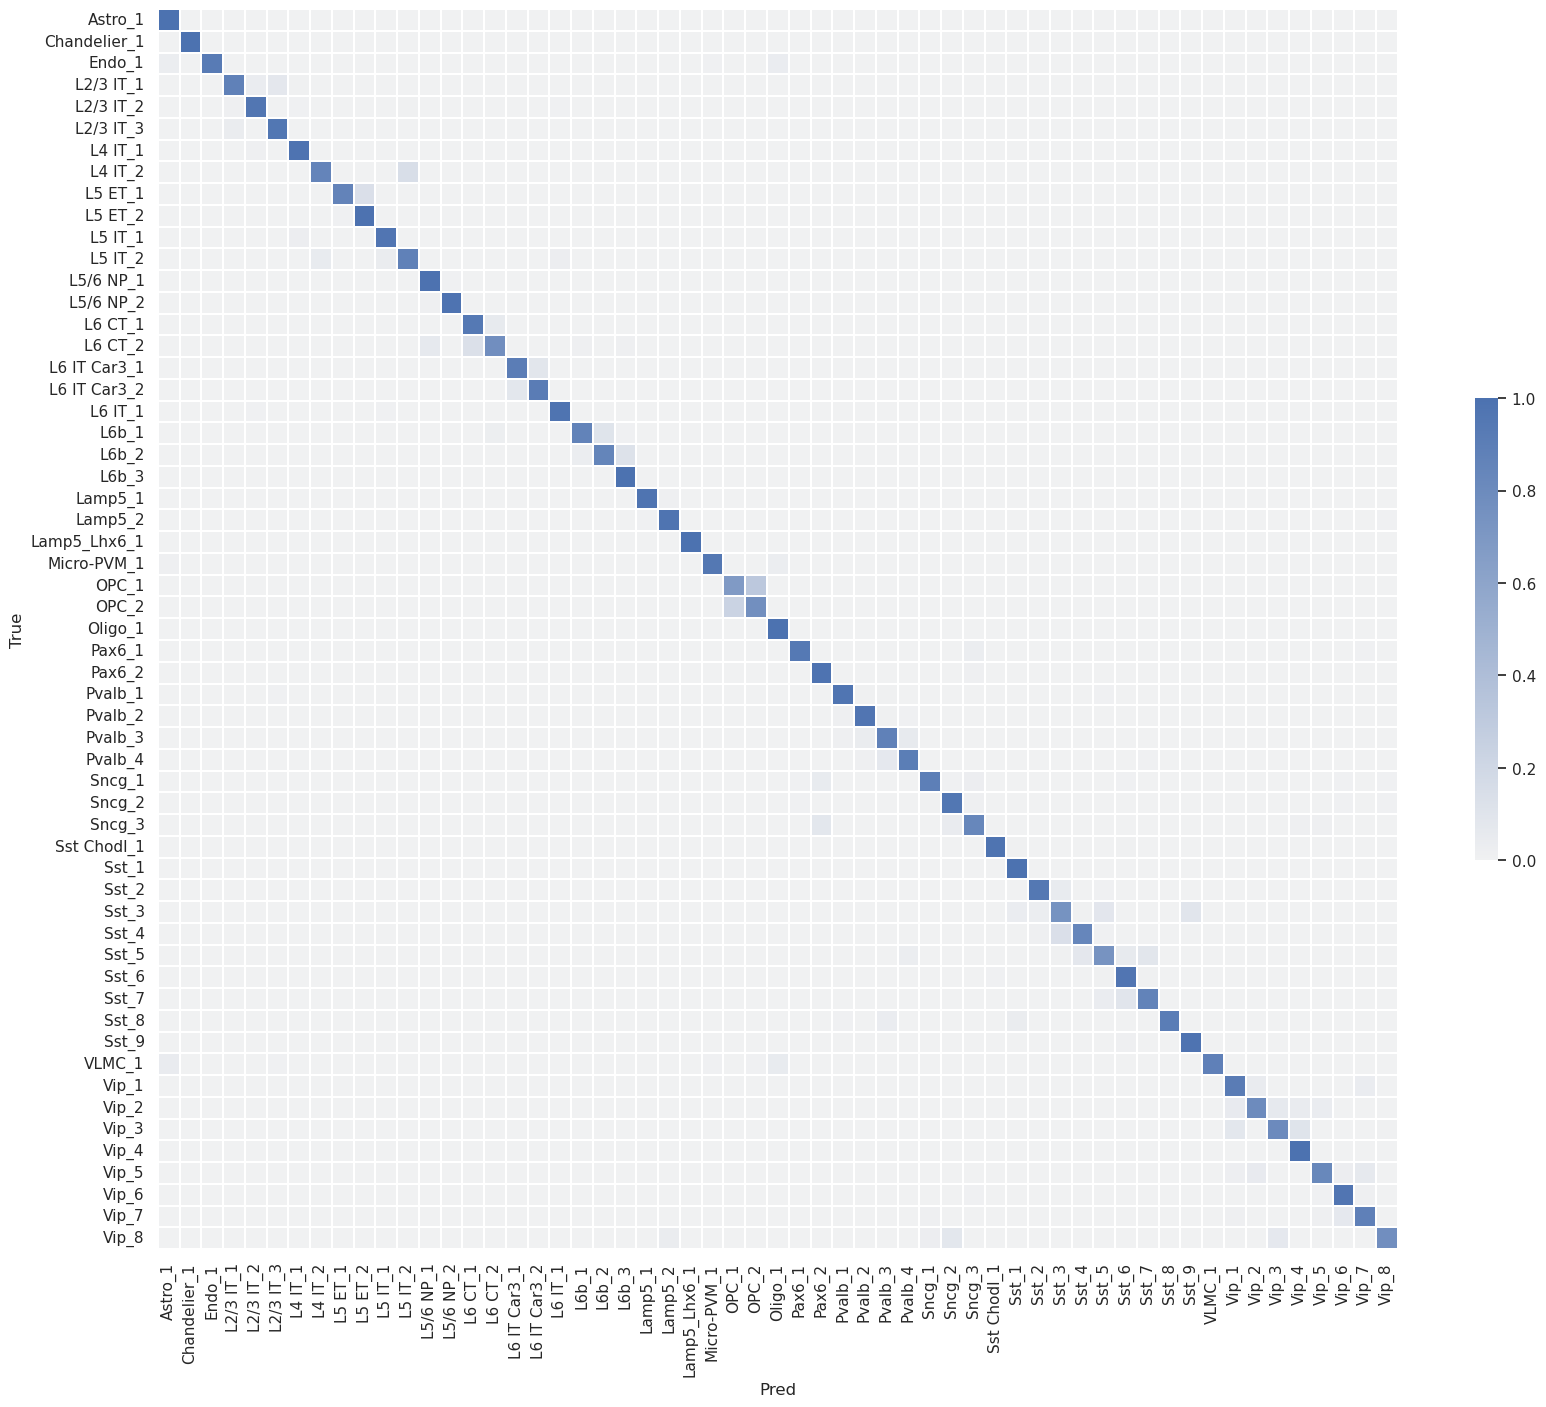
Correlation Mapping
-
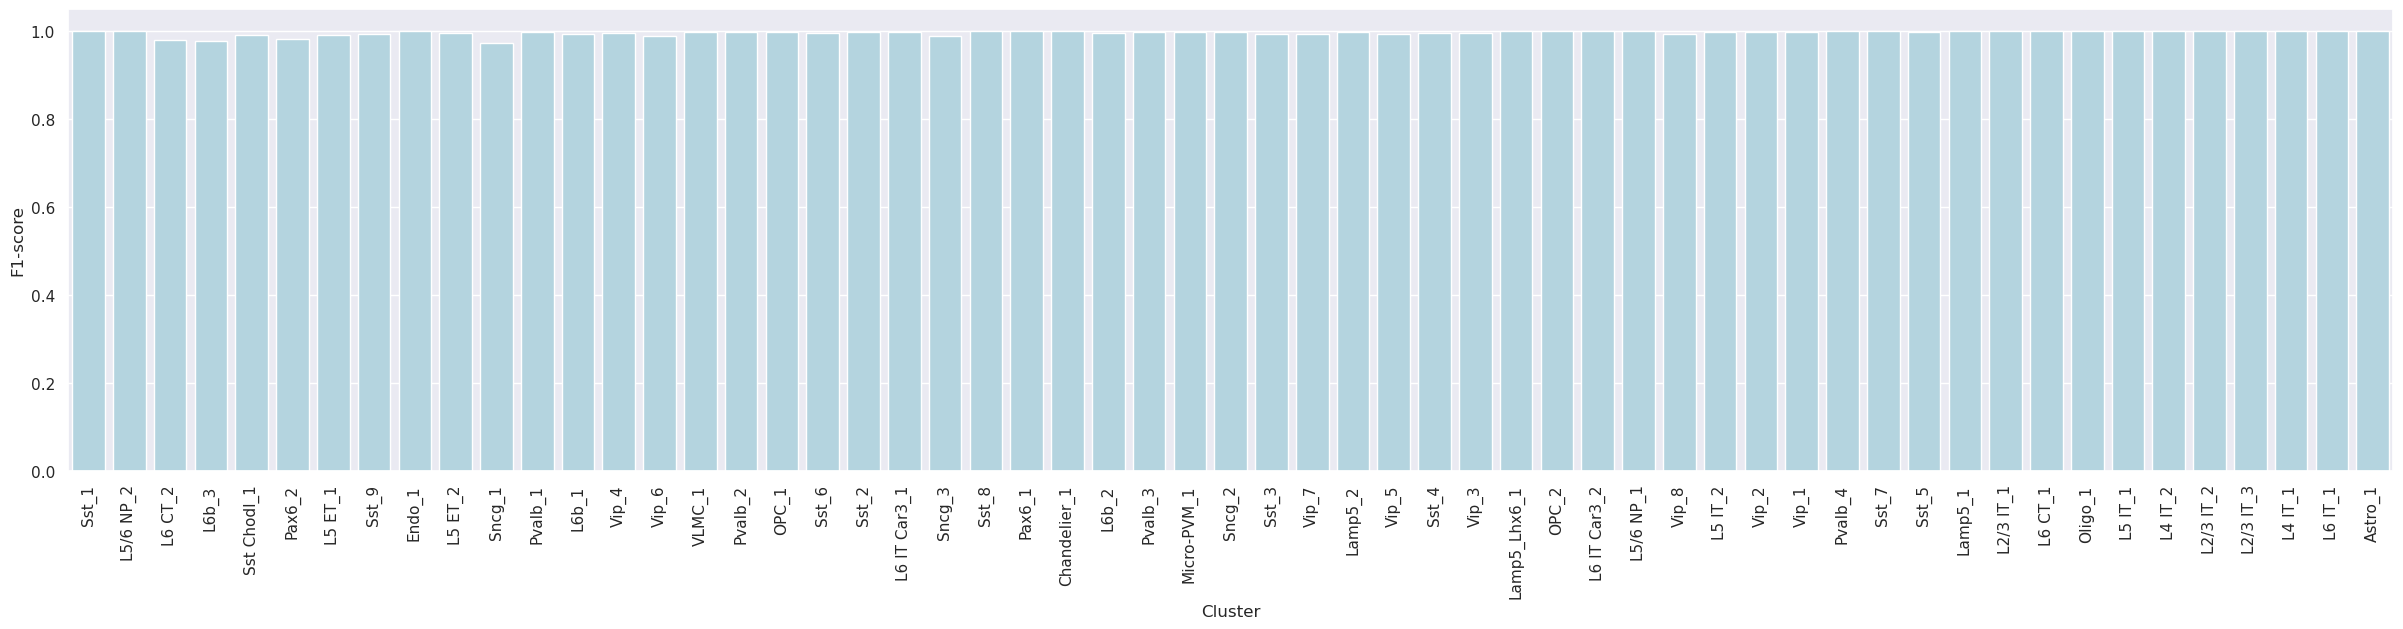
Label-wise F1-score
-
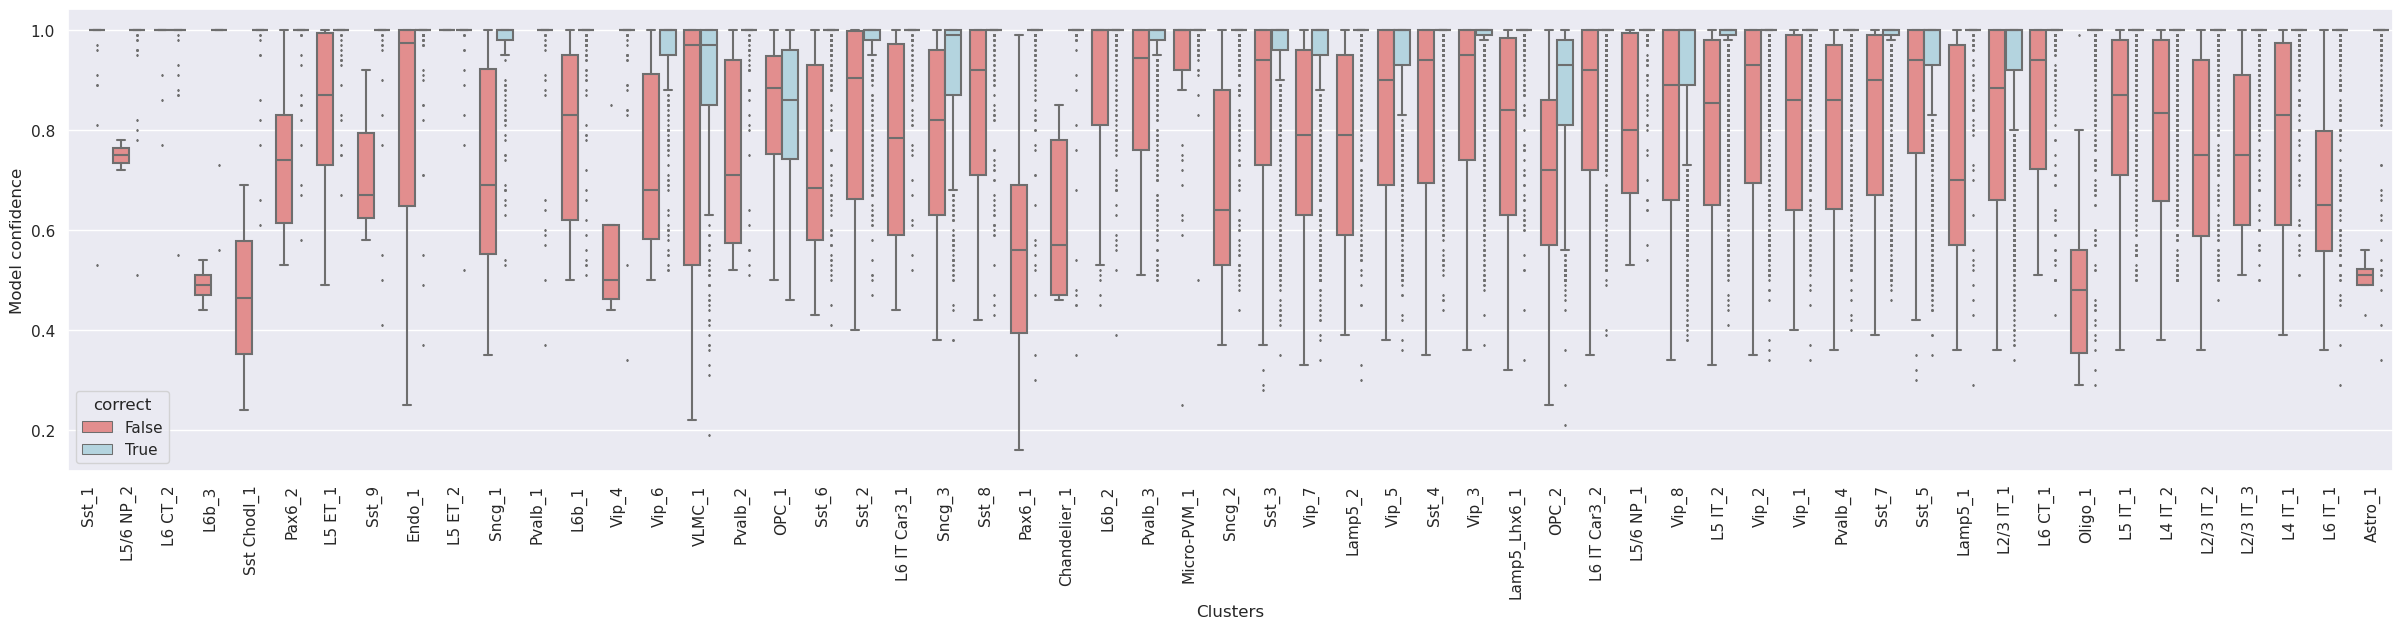
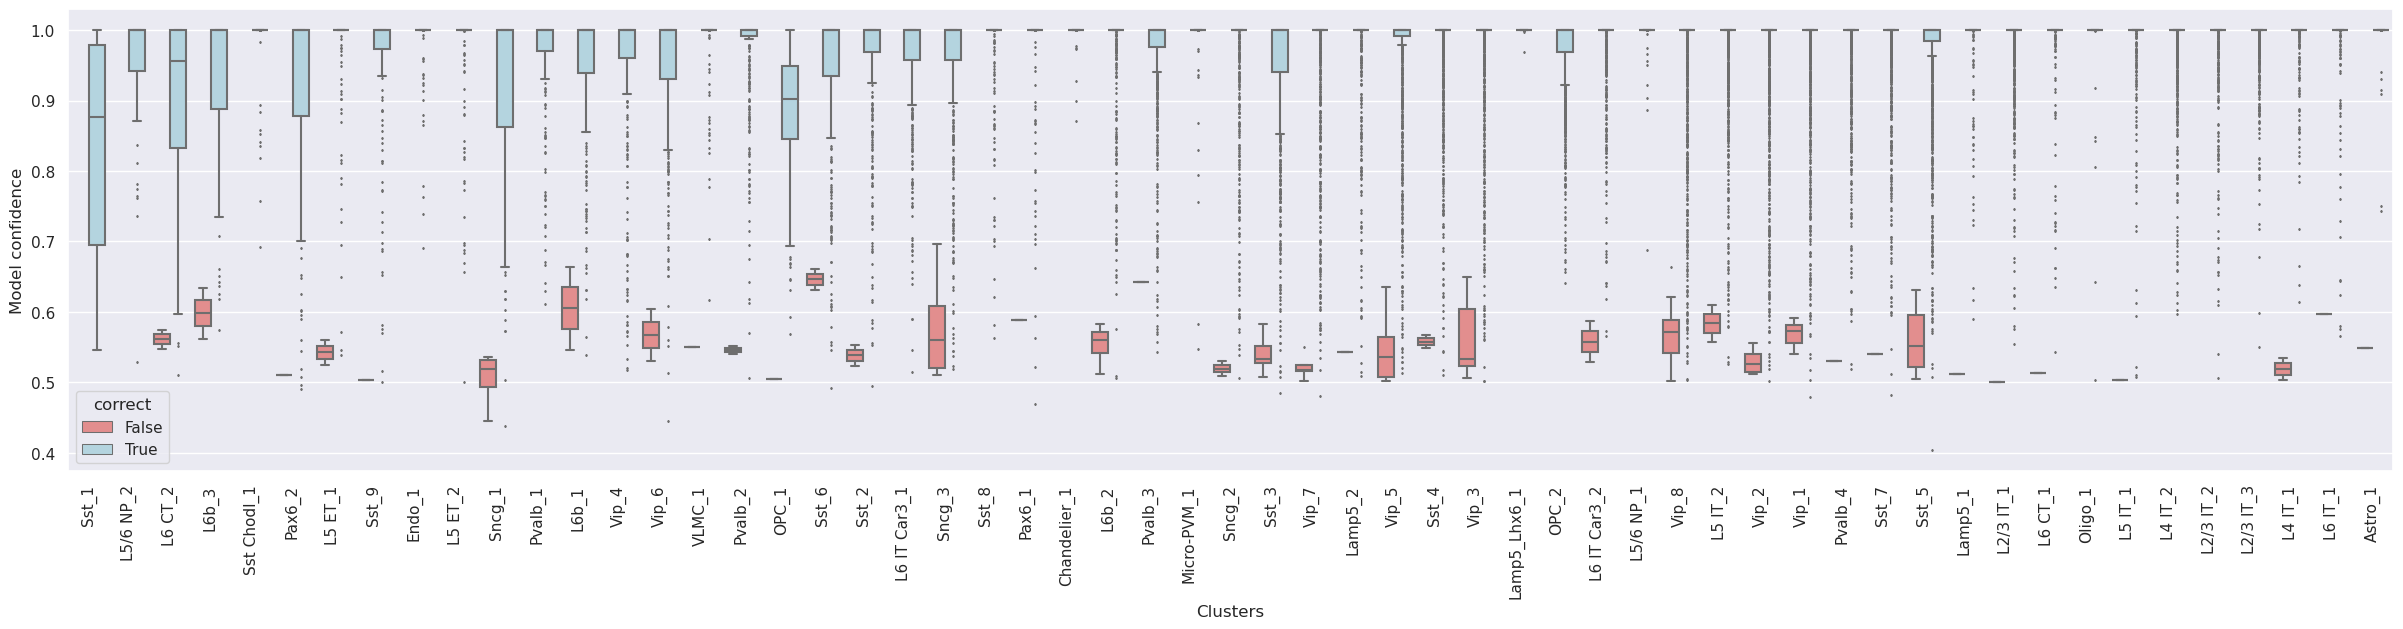
Confidence values for correctly and incorrectly assigned labels
-
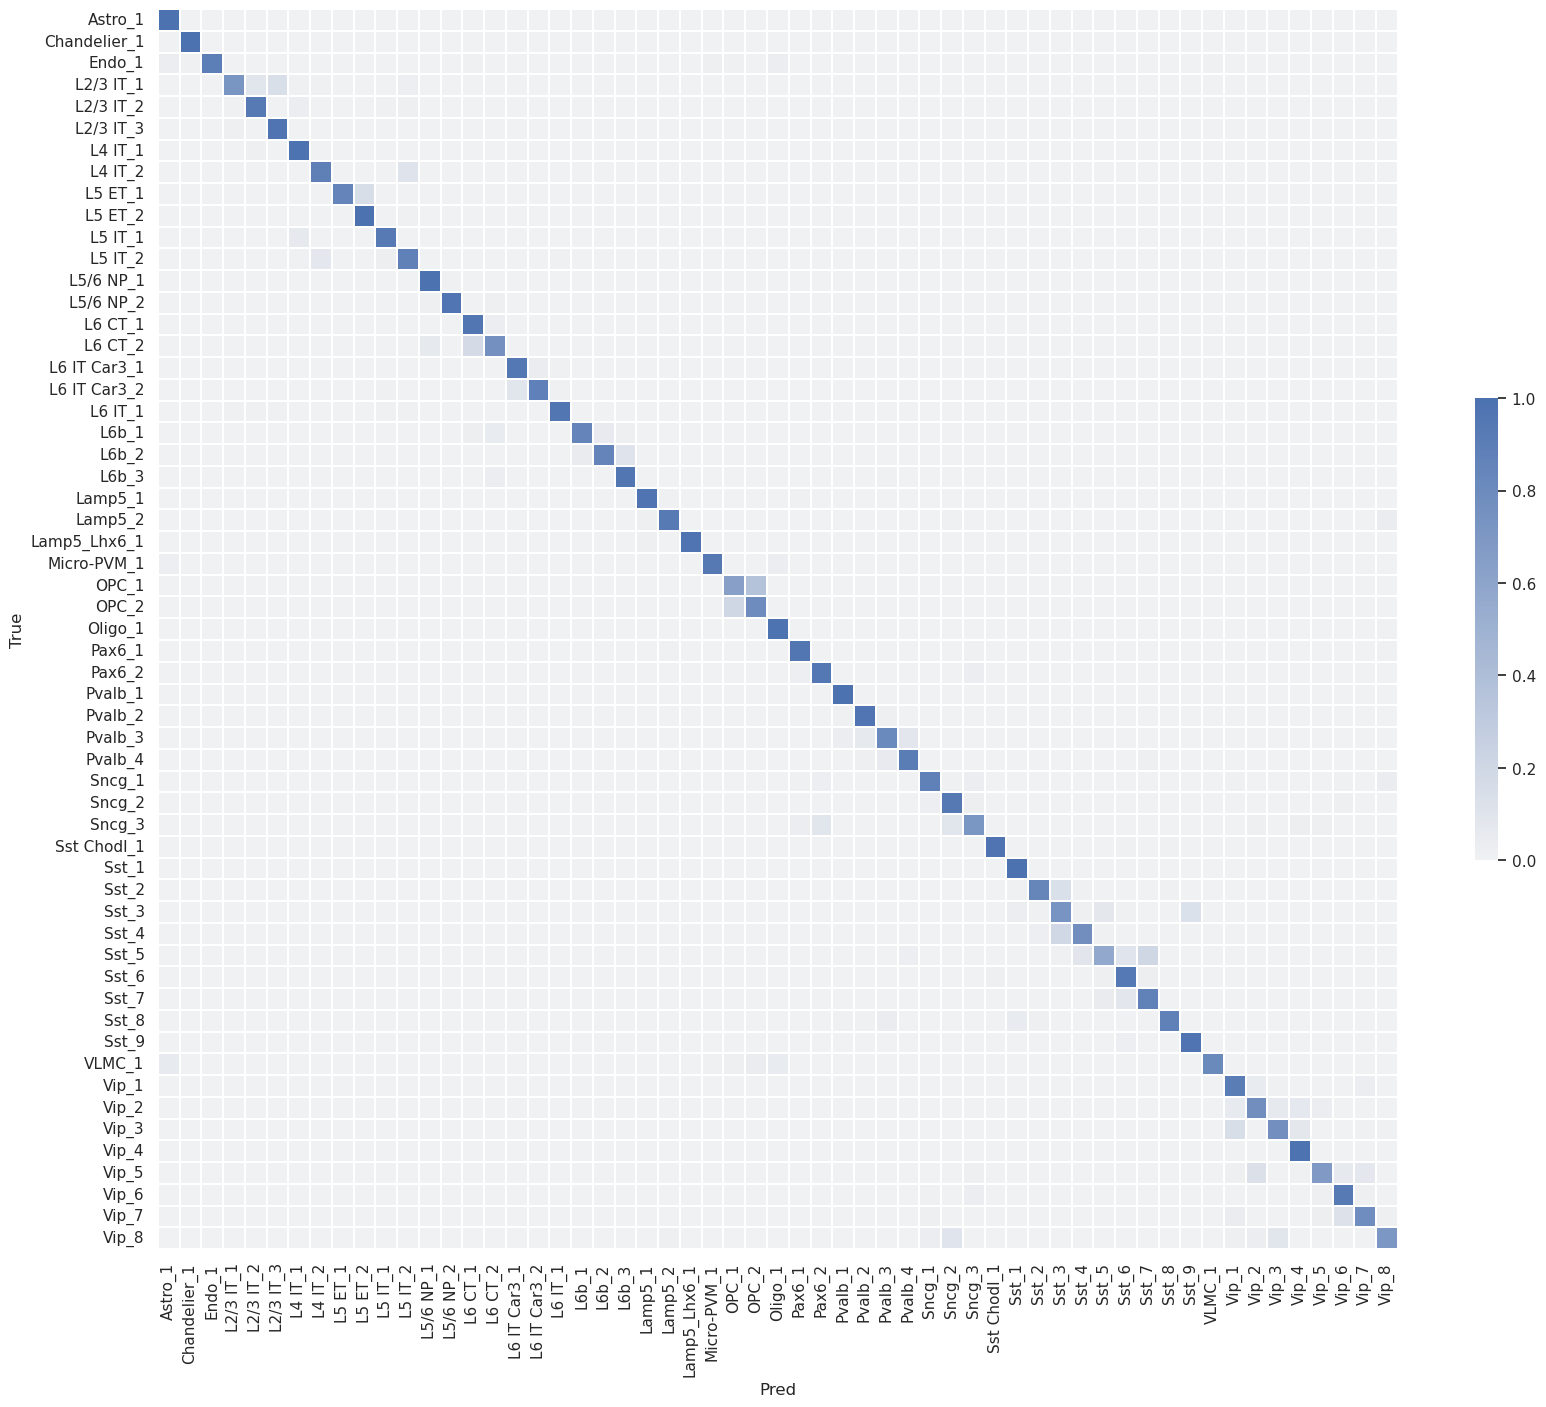
Confusion matrix (row-normalized)
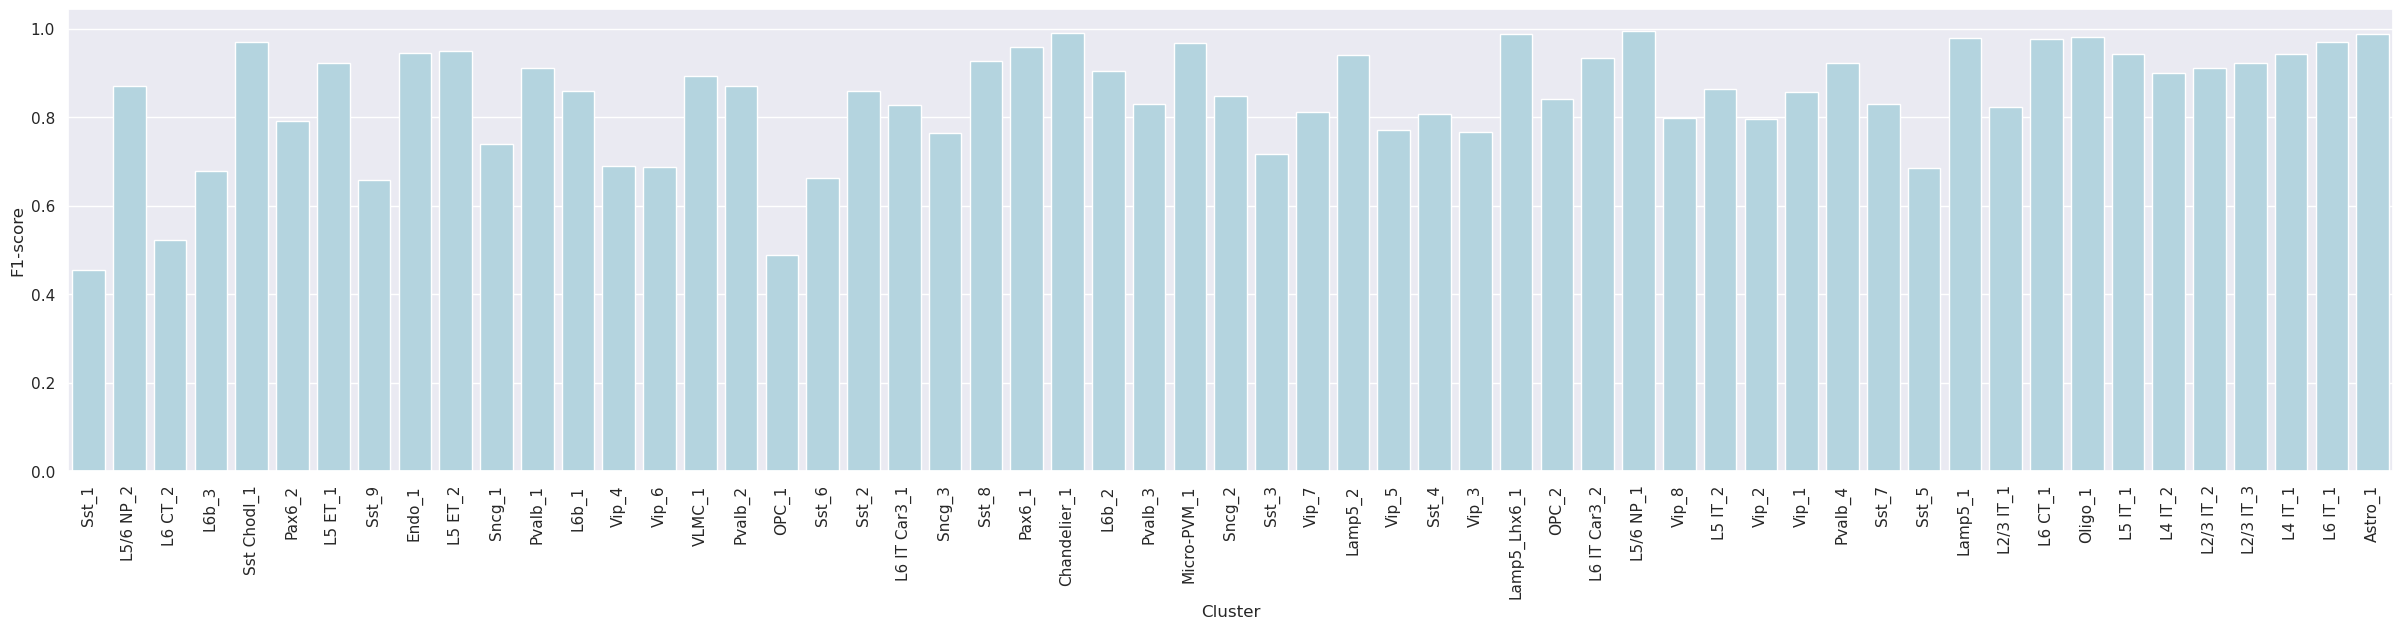
Tree Mapping
-
Label-wise F1-score
-
Confidence values for correctly and incorrectly assigned labels
-
Confusion matrix (row-normalized)
Seurat mapping
-
Label-wise F1-score
-
Confidence values for correctly and incorrectly assigned labels
-
Confusion matrix (row-normalized)
