Cross-areal MTG
Report card for Correlation and Tree Mapping on Middle Temporal Gyrus (MTG) neocortical area (Jorstad et al. 2023)
Overview
A taxonomy was initially built using the Middle Temporal Gyrus (MTG) neocortical area single nucleus dataset. In building the taxonomy, 1000 binary marker genes were selected based on their gene expression from the single-cell transcriptome. Subsequently, the dataset was mapped to itself, termed self-projection, for evaluating the ideal performances of correlation and tree mapping algorithms.
Quantitative analysis
The analysis evaluates the predictions of correlation and tree mappings in determining cluster labels in a self-projection evaluation.
| Annotaion | F1-score |
|---|---|
| Cluster Correlation Mapping | 0.822 |
| Cluster Tree Mapping | 0.784 |
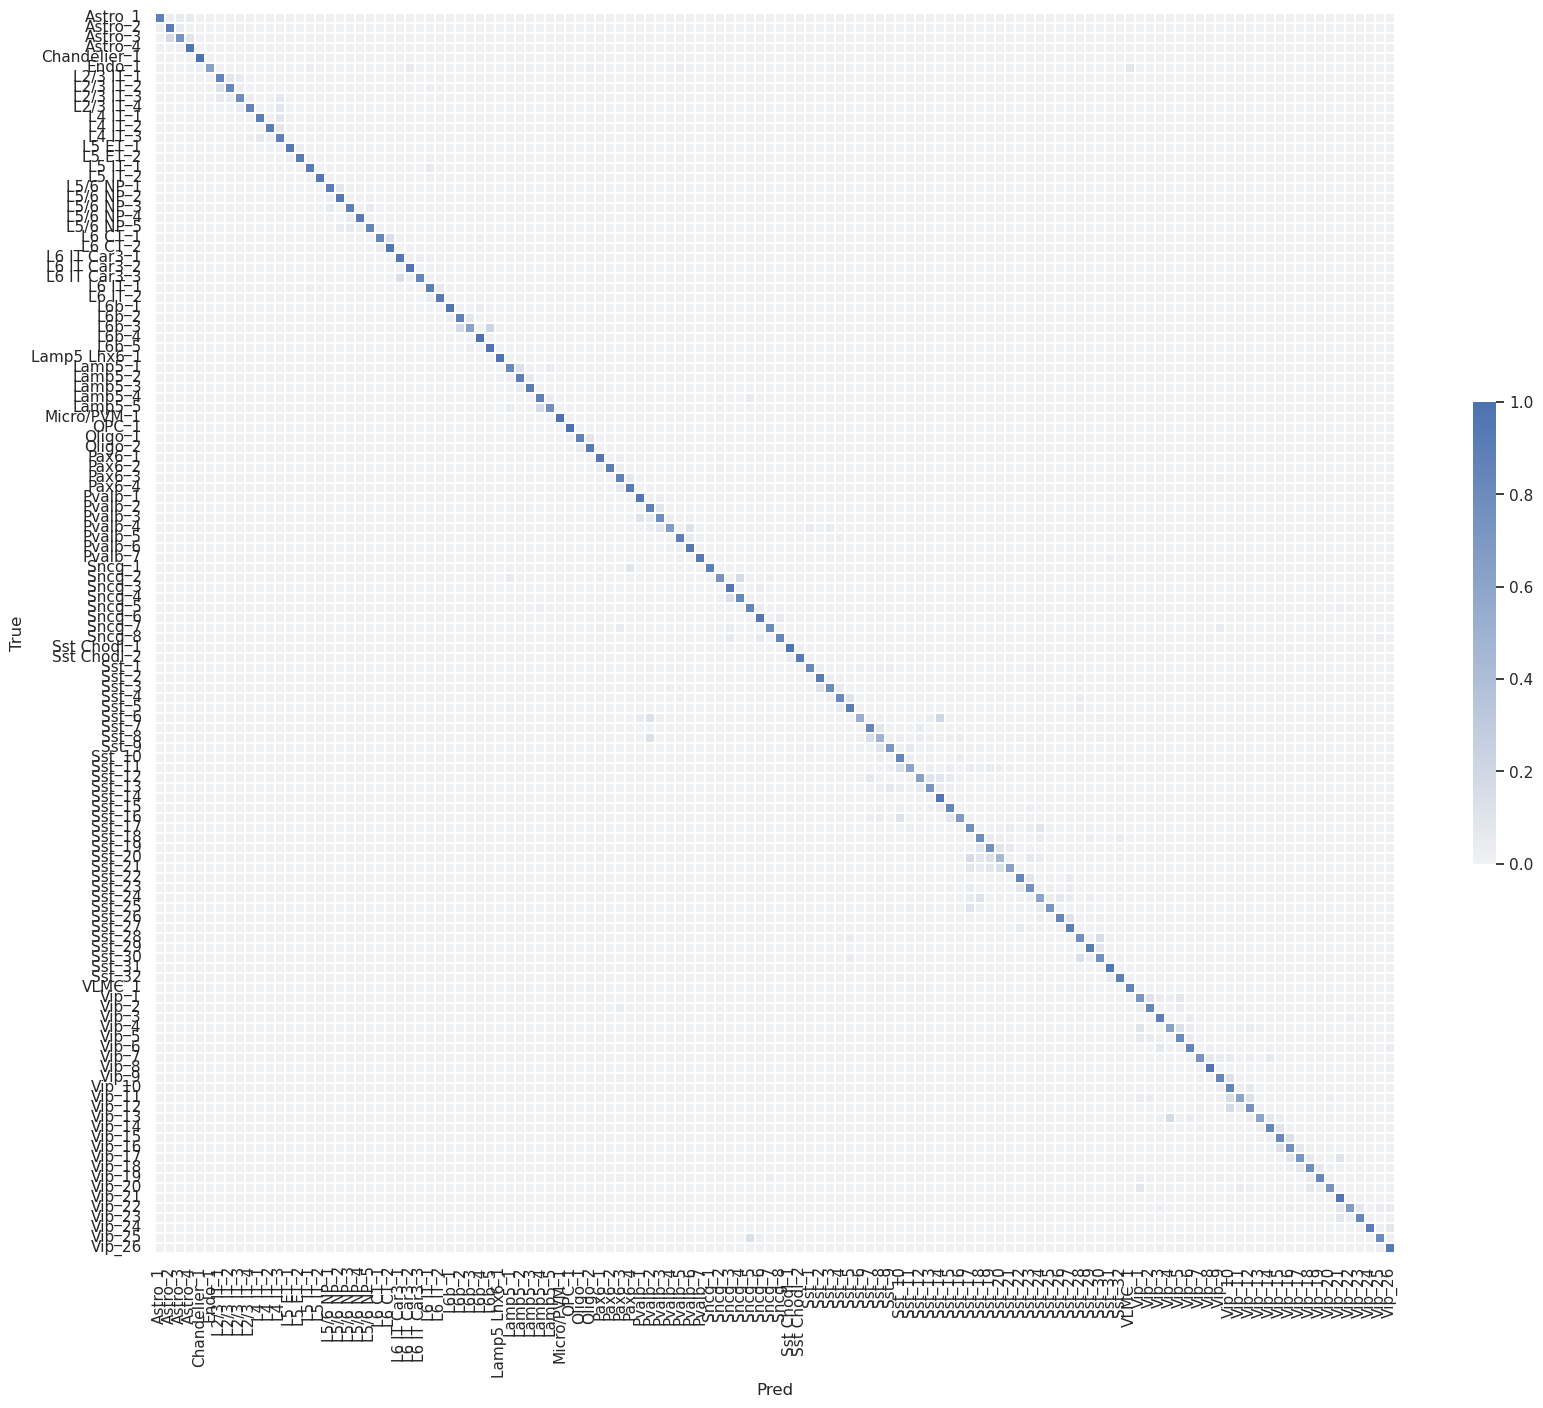
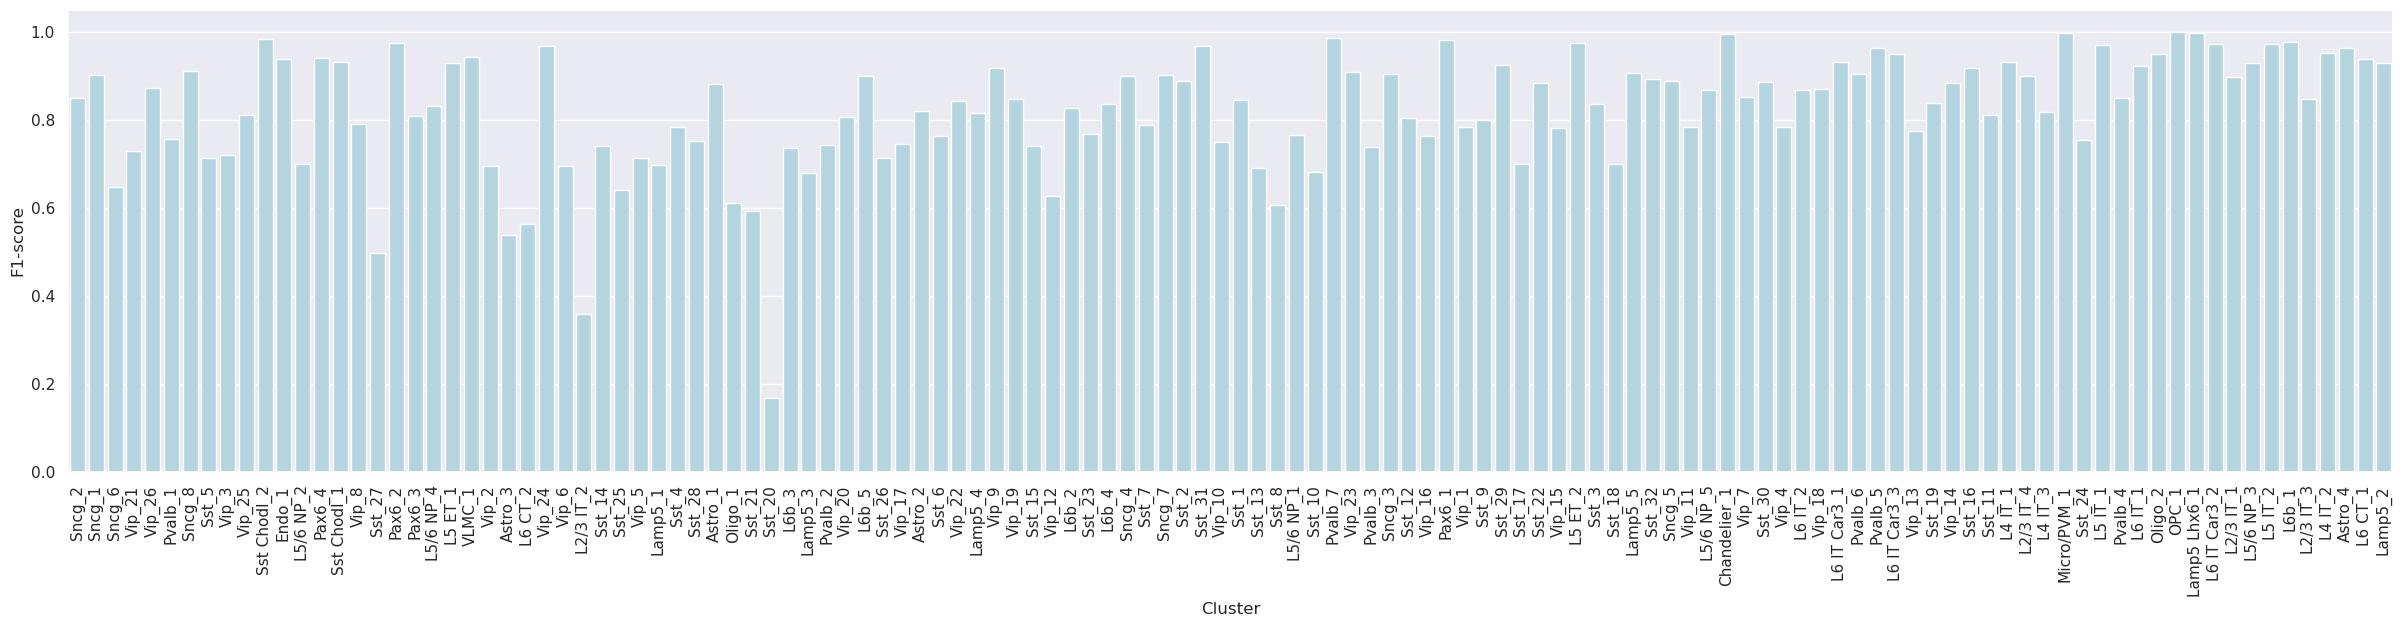
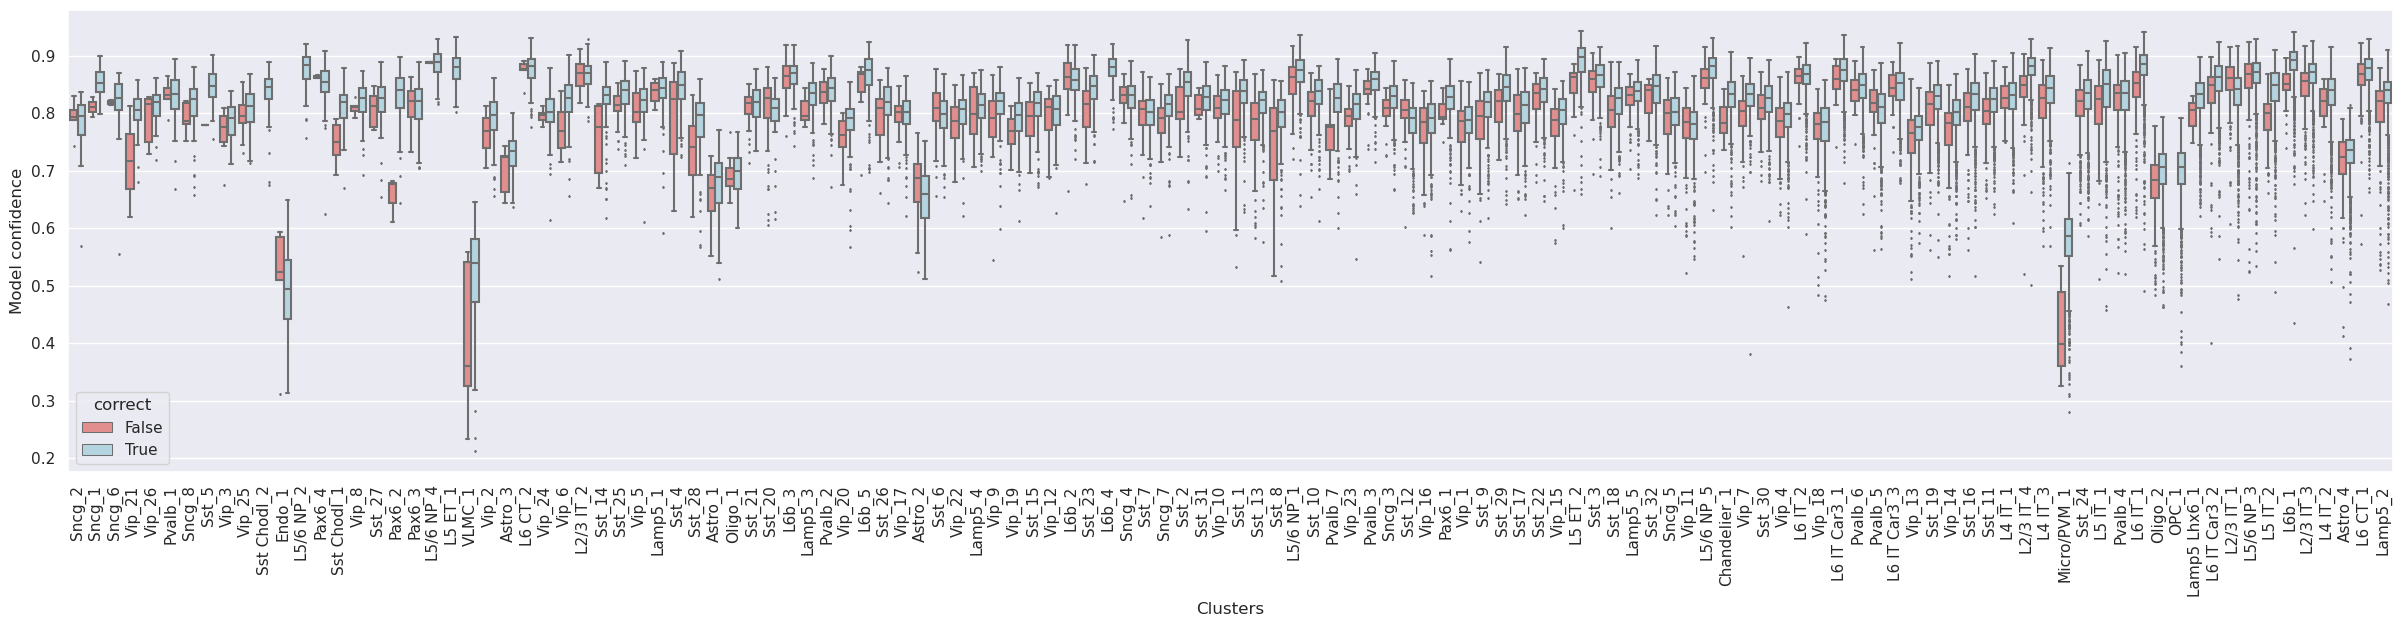
Correlation Mapping
-
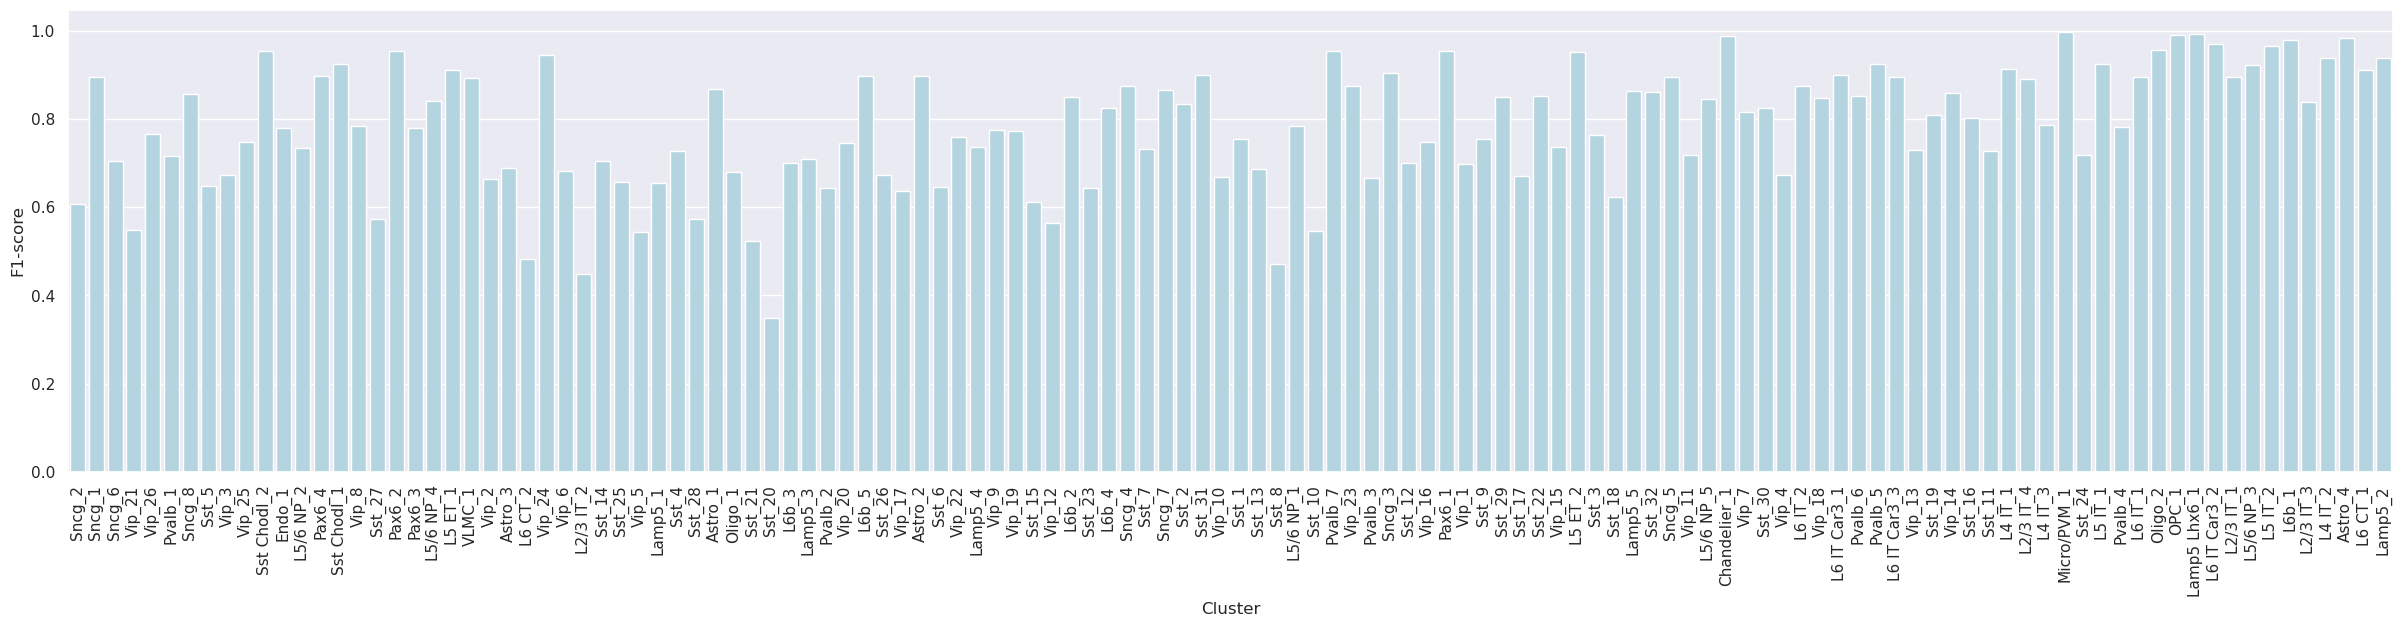
Label-wise F1-score
-
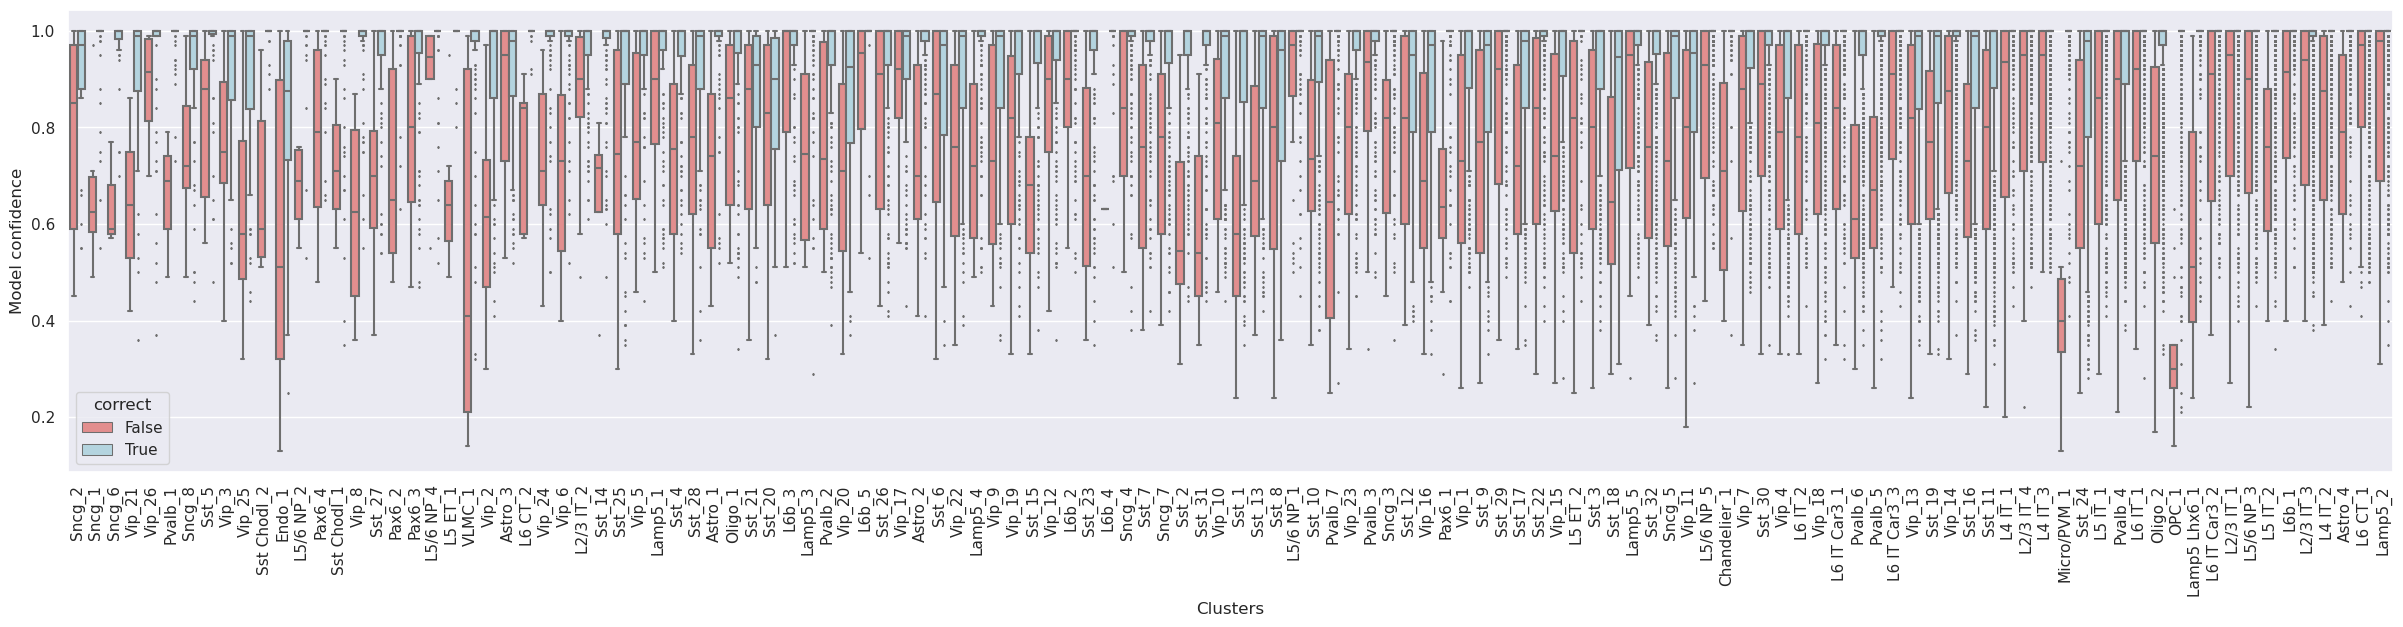
Confidence values for correctly and incorrectly assigned labels
-
Confusion matrix (row-normalized)
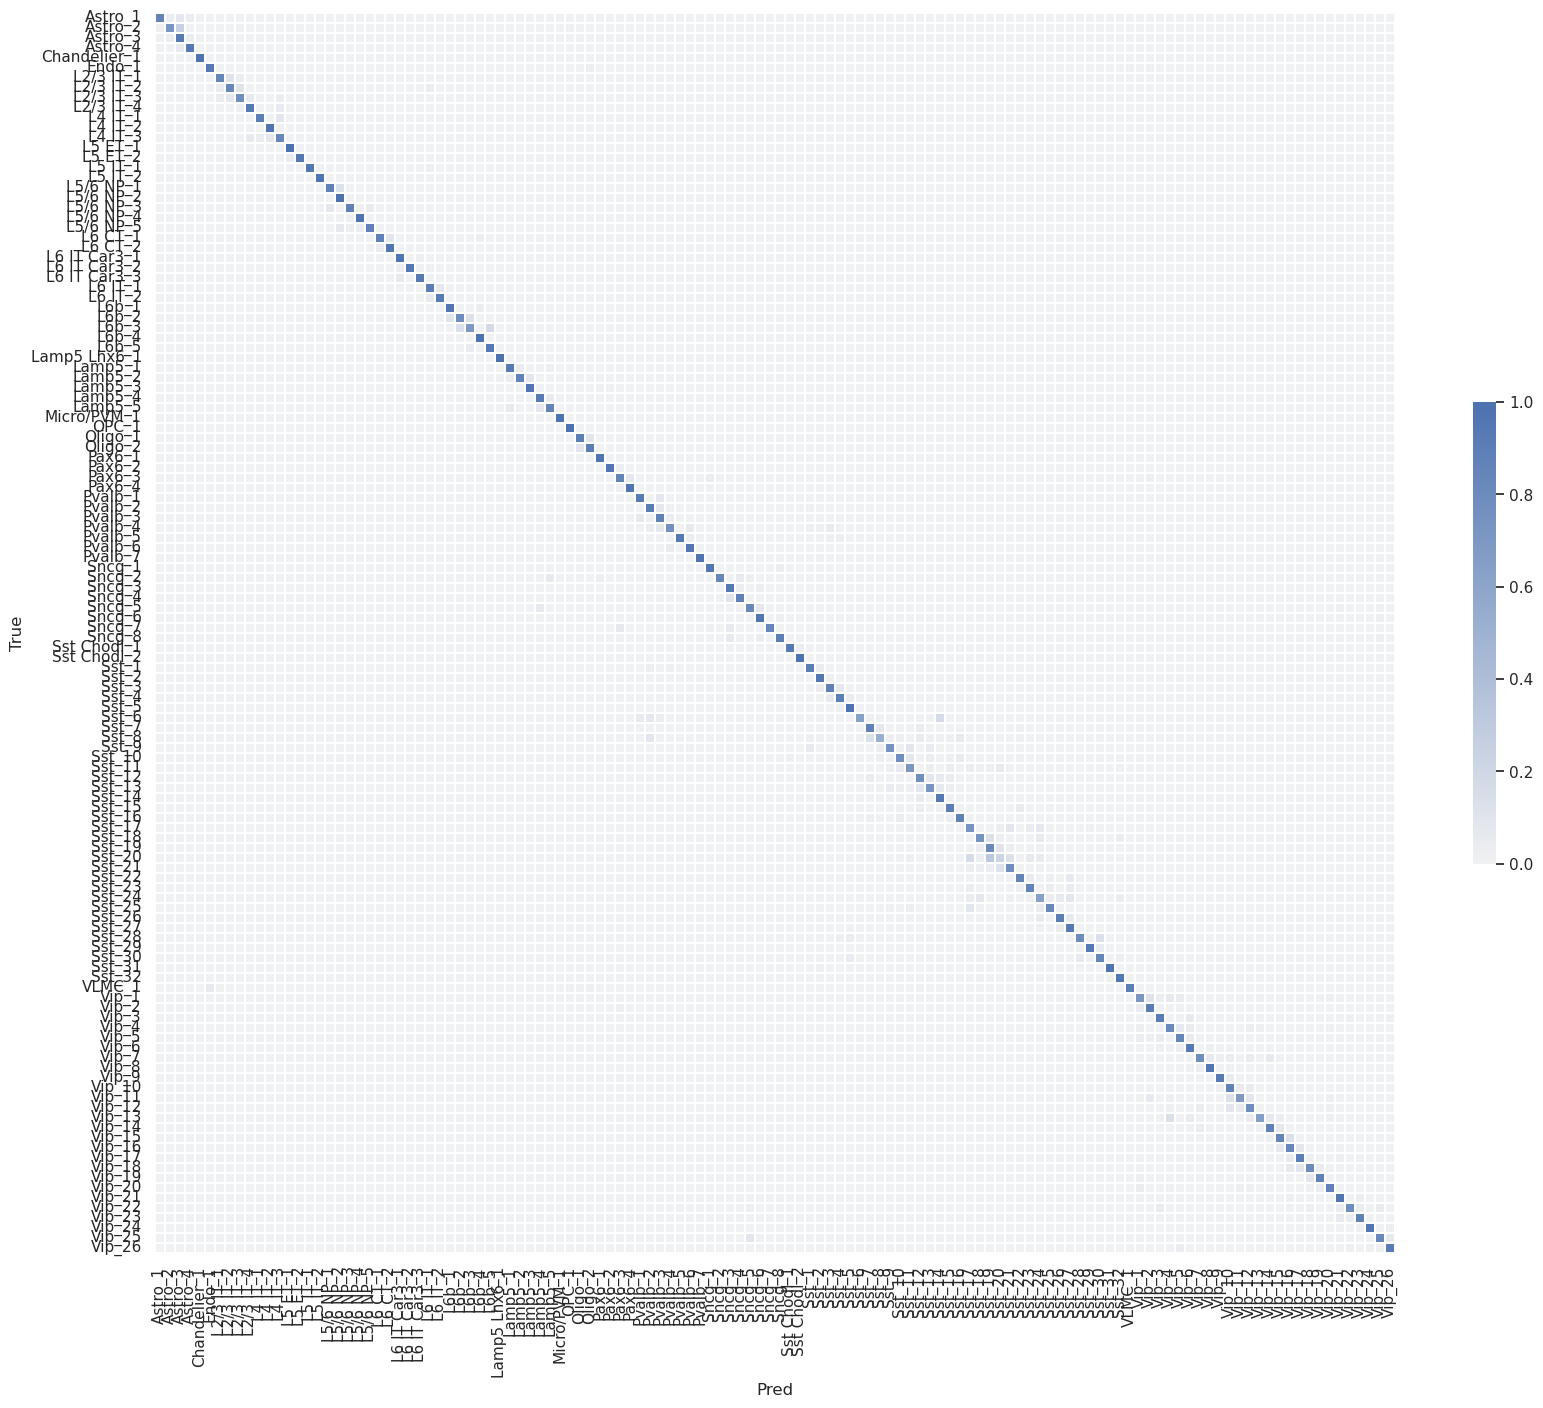
Tree Mapping
-
Label-wise F1-score
-
Confidence values for correctly and incorrectly assigned labels
-
Confusion matrix (row-normalized)